-
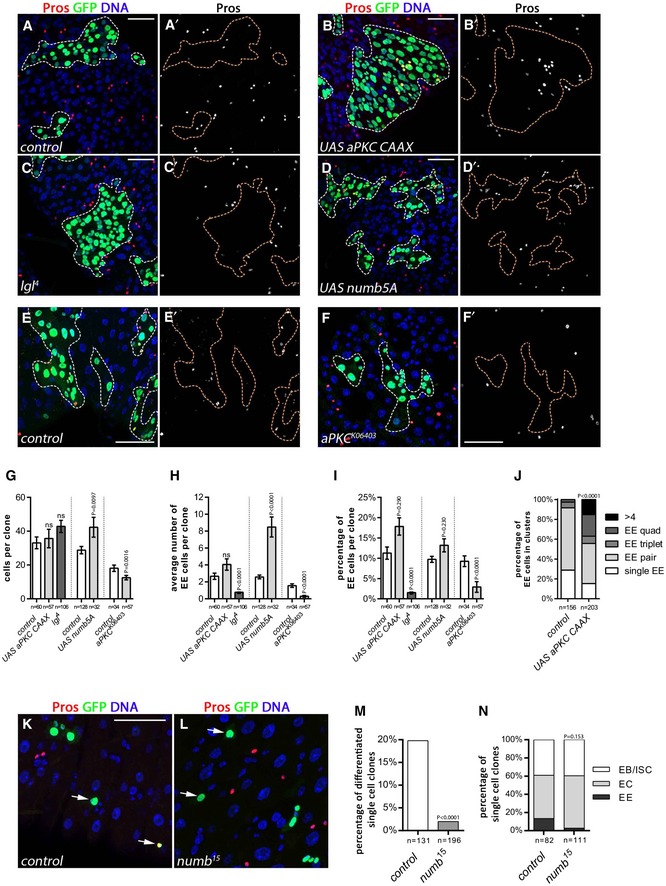
A–F
MARCM clones (GFP, green, outlined; Pros, red; DAPI, blue) observed at 10 days AHS. (A, A′) Wild‐type control clones. (B, B′) Expression of UAS‐aPKC‐CAAX showed a slight increase in EE cells [quantified in (H) and (I)] and a significant increase in clusters of EE cells [quantified in (J)]. A large clone is shown for illustration. (C, C′) EE cells were diminished in lgl
4 mutant clones. (D, D′) Overexpression of UAS‐Numb5A promoted EE formation. (E, E′) Control clones for F, F′. (F, F′) aPKC
06403 mutant clones showed reduced EE cells. Scale bars = 30 μm.
-
G–J
Quantification of: (G) the average clone size, (H) the average number of EE cells per clone, (I) the percentage of EE cells per clone, and (J) the percentage of EE clusters. The bars represent mean values ± SEM.
-
K–N
3 days AHS single‐cell MARCM clones (GFP, green; Pros, red; DAPI, blue). Arrows show single‐cell clones. Scale bar = 20 μm. (K) In wild type, single‐cell EE clones were 20%, (L) whereas single‐cell clones in numb
15 mutant were only 2.6% EEs. (M) Quantification of the percentage of differentiated cells EEs in single‐cell clones. (N) Quantification of the total single‐cell clones.
Data information: (G–J) Results were compared using two‐tailed Mann–Whitney statistical test for (G, H), Fisher's exact test for (I), and χ
2 test for (J) (ns = non‐significant,
P‐values indicated). (M, N) Results were compared using a Fisher's exact test (
P‐value indicated).

