
Figure 1. Quantitative phosphoproteomics reveals potential role of desmosomal protein phosphorylation in epidermal differentiation.
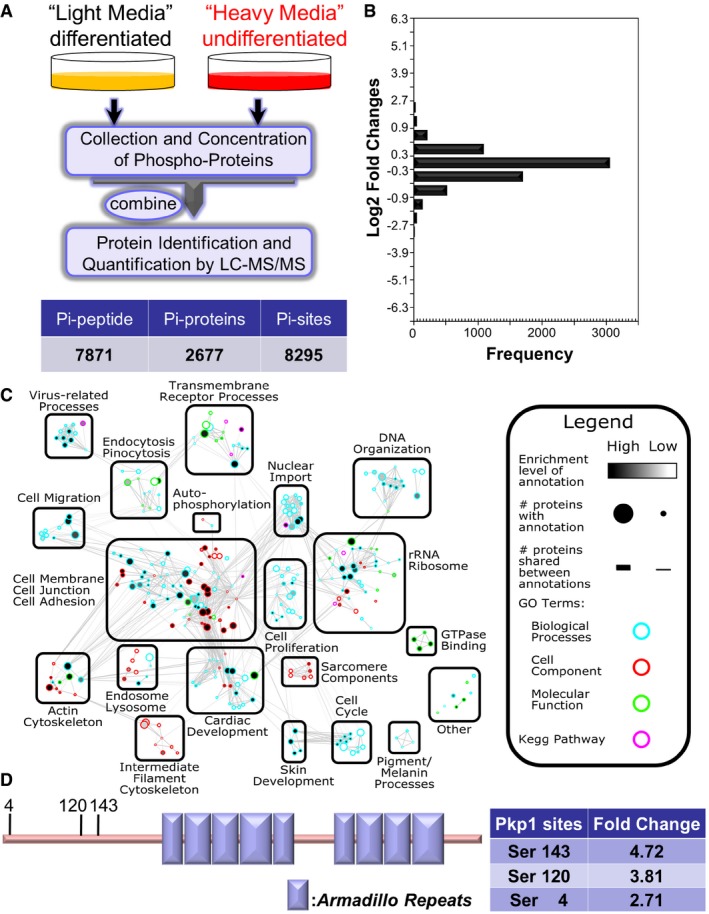
- Diagram of SILAC‐MS workflow. Undifferentiated cells (labeled with regular arginine and lysine) and differentiated cells (labeled with arginine and lysine containing heavy isotope) were mixed together and examined by LC‐MS/MS. Number of identified phosphorylation (Pi) peptides, proteins, and sites are listed in the table below.
- The distribution of normalized log2‐transformed ratios of phosphopeptides enriched in undifferentiated cells compared to differentiated epidermal progenitor cells.
- Mapped enrichment results from proteomics analysis. Proteins of phosphosites with at least twofold increase or decrease in differentiated cell vs. undifferentiated cells were analyzed for GO term and KEGG pathways enrichment using g:Profiler. Visualization of results was performed with Cytoscape and EnrichmentMapApp. Nodes represent a gene set with shared enrichment annotation. Diameter of nodes correspond to the amount of proteins found associated with enrichment term. Outer node color corresponds to GO term or KEGG pathways enrichment terms. Inner node color (gray scale) corresponds to FDR q‐value enrichment significance for given enrichment term. Proteins shared among nodes are denoted as lines between nodes (edges). Edge thickness corresponds to number of proteins shared between two enrichment terms. Terms visualized have a cutoff P‐value and FDR q‐value cutoff of < 0.05.
- Schematic view of Pkp1 (plakophilin) protein structure. Pkp1 contains a large N‐terminal head domain region, nine armadillo domains (boxes), and a small C‐terminal tail region. Three phosphosites enriched in differentiated cells in the head domain region are highlighted with the corresponding fold change listed in the table.