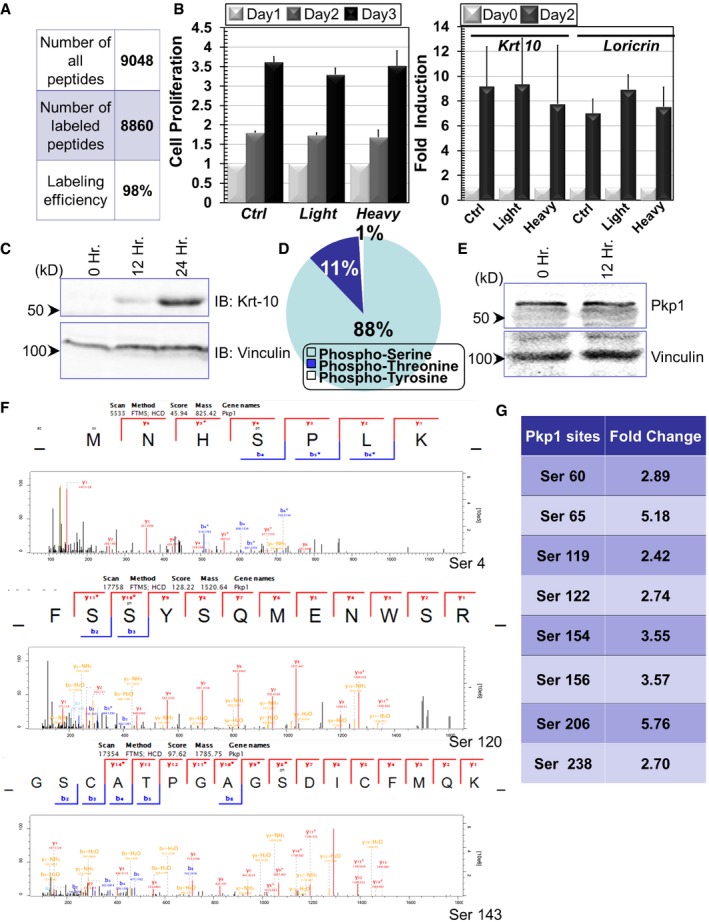
Mass spectrometry quantification indicates the efficiency of SILAC labeling in cultured epidermal basal cells.
Cell proliferation of control (Ctrl) and SILAC labeled cells (light or heavy isotope). Fold increase of cell numbers is quantified for all cell types (left panel). In the right panel, induction of cell differentiation after calcium shift is quantified for control and SILAC labeled cells. Error bars represent SD, n = 3.
Cell lysates were prepared from undifferentiated or differentiated keratinocytes (12 or 24 h post‐calcium shift) and subjected to immunoblots with different antibodies as indicated. Hr: hour. Numbers on left side indicate molecular weight markers. kD: kilodalton.
Percentage of distribution of different phosphorylated residues in phosphoproteome of epidermal stem cells.
Cell lysates were prepared from undifferentiated or differentiated keratinocytes (12 h post‐calcium shift) and subjected to immunoblots with different antibodies as indicated.
Annotated spectra of the three Pkp1 phosphorylation sites at the N‐terminal head domain.
Other potential phosphosites in Pkp1 head domain that were identified in our proteomics analysis are listed in the table.

