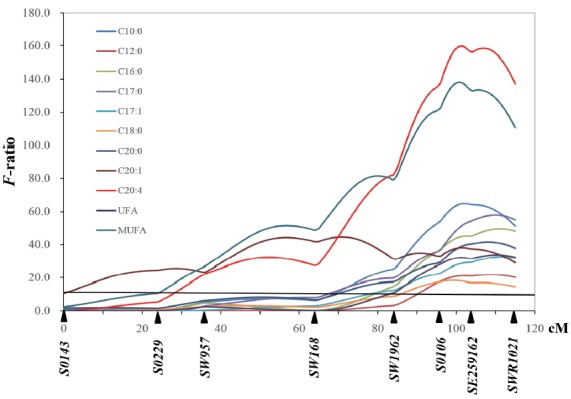
Figure 1.

Quantitative trait loci (QTL) profiles for fatty acid composition traits on SSC12. The y-axis represents the F-value testing the hypothesis of a single QTL under additive model on a given position on the chromosome. The marker map with genetic distance between microsatellite (MS) markers in Kosambi cM is given on the x-axis. The horizontal line indicates the 5% genome-wide significant threshold.
