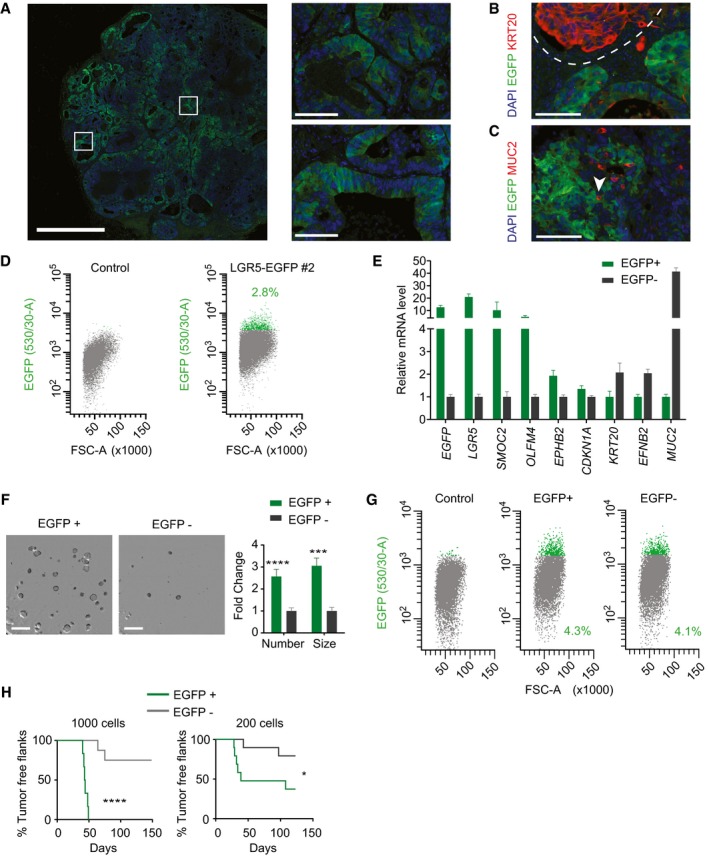
Representative images of EGFP patterns analyzed by immunofluorescence on a section of PDO#7‐LGR5‐EGFP#2‐derived subcutaneous xenograft. White squares are magnified in insets. Scale bars indicate 1 mm for the whole xenograft, 100 μm for the magnified insets.
Dual immunofluorescence of clone #2 for KRT20 and LGR5‐EGFP that illustrates complementary expression domains of the marker genes. Dashed line delimits expression domains in adjacent glands. Scale bar indicates 100 μm.
Dual immunofluorescence of clone #2 for MUC2 and LGR5‐EGFP. White arrows point to LGR5−/MUC2+ tumor cells. Scale bar indicates 100 μm.
Flow cytometry profiles of EGFP+ and EGFP− disaggregated xenografts. Only EPCAM+ cells are shown.
Relative expression levels assessed by RT–qPCR of ISC and differentiation genes in EGFP+ and EGFP− cells isolated from disaggregated xenografts. Values show mean ± standard deviation (s.d.) of three measurements.
Representative images and quantifications of organoid formation by EGFP+ versus EGFP− cells isolated from xenografts (n = 4 wells per condition). Data is represented as mean ± s.d. Scale bars indicate 1 mm.
Representative flow cytometry analysis of 15‐day grown organoids formed by EGFP+ and EGFP− sorted populations.
Tumor initiation capacity of 1,000 and 200 sorted epithelial cells from xenografts that were re‐inoculated into recipient mice. Graphs show Kaplan–Meier plots (n = 9 xenografts for condition. In EGFP+ 1,000 cells n = 6).
Data information: Differences in organoid formation were assessed with Student's
‐value < 0.0001. The exact
.