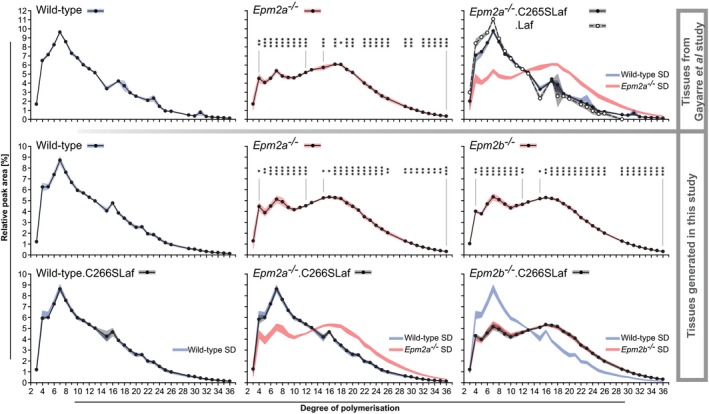
Figure 5. Phosphatase‐inactive laforin rescues brain glycogen chain length distribution in Epm2a −/− but not Epm2b −/− LD.

Top row from tissues from the Gayarre et al (2014) study; bottom two rows from mice generated in the present work. Chain lengths (x‐axes) are given as degrees of polymerization (DP), that is, numbers of glucose units per chain. Laf indicates WT laforin transgene expressed in indicated LD genotype. C265SLaf and C266SLaf indicate phosphatase‐inactive murine or human laforin, respectively, expressed in indicated LD genotype. Data are presented as means of relative peak areas for each DP with shades representing standard deviation (SD; blue, WT; red, Epm2a −/− or Epm2b −/−; grey, indicated transgenic mice; n > 5, for Epm2a −/−.Laf samples were pooled). In all panels relating to transgenic mice, in addition to the chain length distribution in these mice, SD shades of WT or respective knockout mutants (Epm2a −/− or Epm2b −/−) are shown to allow direct comparisons of the chain length distribution curves. Asterisks, statistical significance by ANOVA and post hoc analyses with regard to DP abundances in respective WT glycogen (*P < 0.05, **P < 0.01, ***P < 0.001; Appendix Table S4).
