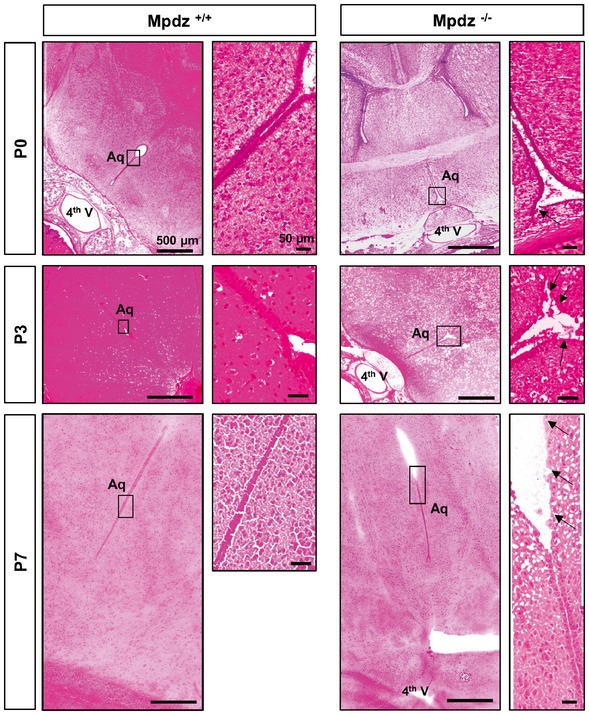
Figure 5. Ependymal defects in the cerebral aqueduct of Mpdz −/− mice.

H&E staining of horizontal brain sections from of Mpdz −/− and Mpdz +/+ littermates at postnatal days 0, 3, and 7 (P0, P3, and P7). A continuous single layer of ependymal cells lines the aqueduct in controls. Disruption of the ependymal cell layer was frequently observed in Mpdz‐deficient mice. The images at the right show areas of interest (boxed) in higher magnification. Arrows indicate regions where the ependymal layer is disturbed. Please note that images of Mpdz +/+ brains (P0, P3) are close‐ups of the images shown in Fig 3. Scale bars are indicated in images.
