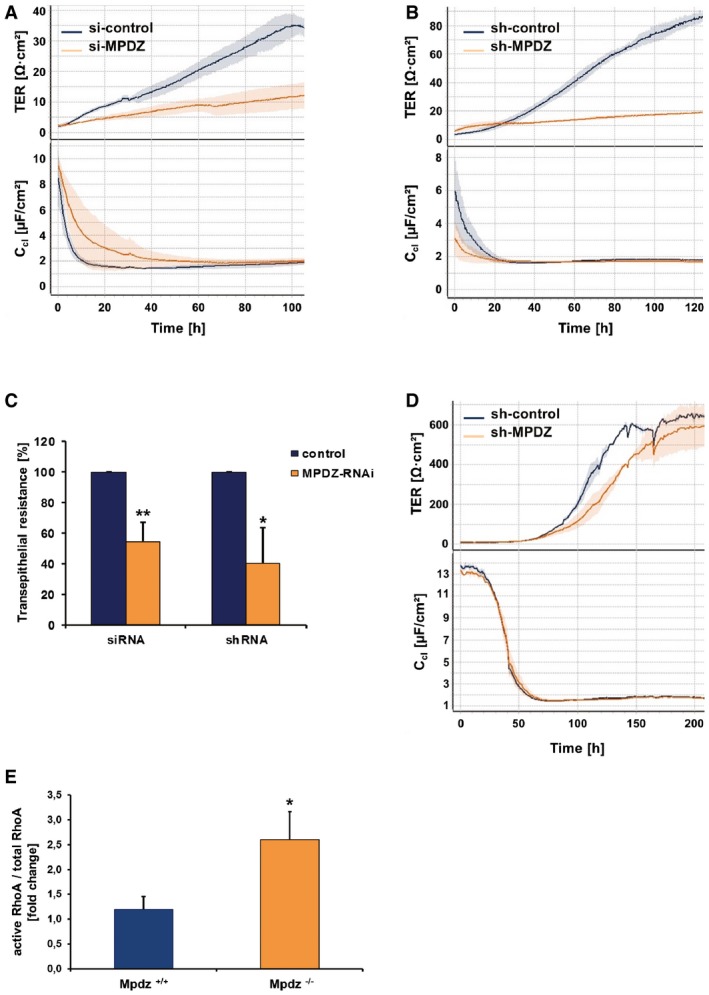
Figure 6. Loss of MPDZ increases epithelial cell permeability.

-
A, BRepresentative graph of transepithelial electrical resistance (TER; upper graph) and corresponding capacitance (Ccl; lower graph) of MCF‐7 monolayers for 5 days after silencing of MPDZ expression. The reduction of MPDZ expression led to a significant decrease of TER indicating increased permeability. The low corresponding capacitance (Ccl) values indicate formation of a dense cell monolayer. n = 3 technical replicates.
-
CMean TER values of five (siRNA) or three (shRNA) independent experiments with each three replicates at time point 72 h. **P = 0.008; *P = 0.0113 by two‐sided, unpaired Student's t‐test.
-
DRepresentative graph of TER and corresponding capacitance (Ccl) of HIPCC cell monolayers for 5 days after silencing of MPDZ expression. n = 3 replicates.
-
ELevels of active RhoA (RhoA‐GTP) and total RhoA levels in isolated astrocytes derived from brains of neonatal Mpdz −/− and Mpdz +/+ mice were detected by G‐LISA. Graph shows ratio of active RhoA vs. total RhoA. n = 3; P = 0.0171 by two‐sided, unpaired Student's t‐test).
