
Figure 2. Characterization of distinct stages of cardiac differentiation.
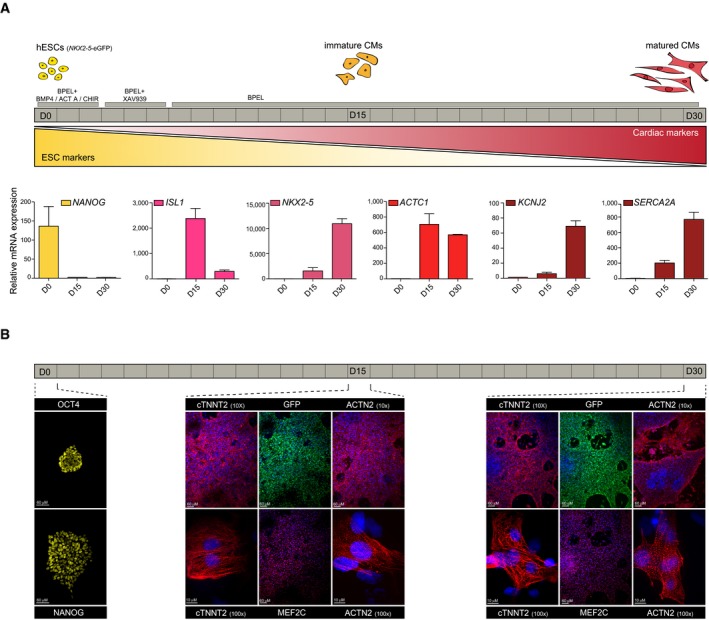
- Schematic of the directed cardiac differentiation and the three different stages used in this study. hESCs: human embryonic stem cells. CM: cardiomyocyte. Below are mRNA expression levels of pluripotency and cardiac markers as measured by qRT–PCR. Expression levels were normalized to a non‐oscillatory housekeeping gene (PPIA). Data are represented as mean ± s.e.m. of three independent replicates.
- Immunostaining for pluripotency markers OCT4 and NANOG (yellow) in human ES cells. cTNNT2 and sarcomeric actin (red) stainings reveal clear sarcomeric structures at all cardiac stages. Cardiomyocyte nuclei were stained for MEF2C (red), NKX2‐5‐eGFP‐positive cells were stained with anti‐GFP (green) and nuclei with Hoechst (blue).