
Figure 4. Identification of oscillatory transcripts at D15 and D30.
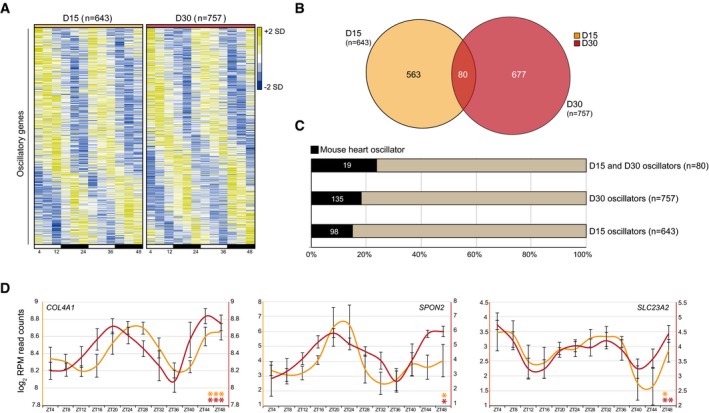
- 643 and 757 oscillators for D15 and D30 cultures, as analyzed using JTK‐cycle (adj. P < 0.05). Heatmaps represent z‐normalized RPM values of the average of three independent replicates. Oscillatory genes were ranked by their phase of expression and visualized using Java TreeView.
- Venn diagram of JTK‐cycle detected oscillators for D15 and D30.
- Fraction of JTK‐cycle detected oscillators that were previously found to be rhythmically expressed in mouse hearts 14.
- Examples of overlapping oscillators between D15, D30 cardiac cells and mouse hearts. Average log2 RPM read counts of three replicates, smoothened over 2 time points ± s.e.m., were plotted. Significance of rhythmicity across 48 h was analyzed using the JTK‐cycle algorithm (* JTK P < 0.05, ** JTK P < 0.005, and *** JTK P < 0.0005).