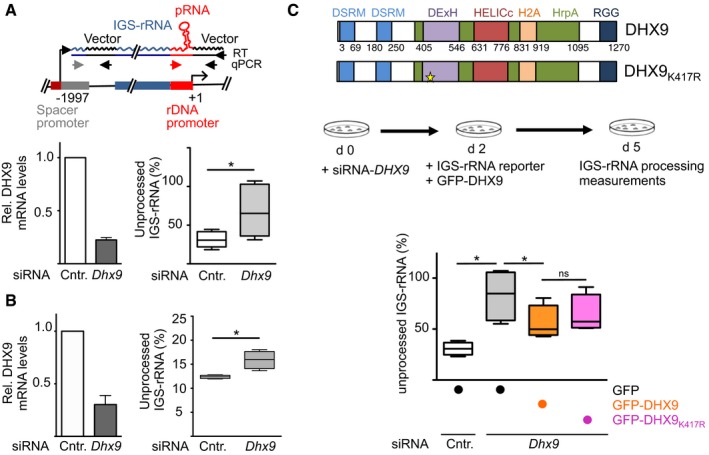
Schema depicts the IGS‐rRNA reporter plasmid. Black arrows represent primers used to perform RT or to amplify plasmid sequences. Gray and red arrows indicate primers hybridizing to rRNA sequences. siRNA‐DHX9 or siRNA‐control‐treated NIH 3T3 cells were transfected with IGS‐rRNA reporter plasmid. Transcripts are measured by strand‐specific reverse transcription (RT) using a primer hybridizing vector sequences downstream the main rRNA gene promoter followed by amplification of pRNA (red and black arrows) and 5′‐IGS‐rRNA regions (gray and black arrows). Data from six experiments are represented as values of amplifications of the 5′‐region of IGS‐rRNA (unprocessed) normalized to amplifications of pRNA sequences (unprocessed + processed) of the reporter plasmid. Box plots depict the minimum and maximum values. The median is represented by a horizontal line within the boxes. DHX9 knockdown efficiency is shown on the left. Transcripts were normalized to GAPDH mRNA levels and siRNA‐control samples (mean ± SD).
Measurements of endogenous IGS‐rRNA levels in NIH 3T3 cells depleted of DHX9 by siRNA. Data from four experiments have been measured for endogenous transcripts as described in (A).
Schema depicts the domain organization of DHX9 and the strategy used to measure processing upon expression of plasmids expressing GFP‐DHX9 in NIH 3T3 cells depleted of DHX9 by siRNA. Values are from four independent experiments and were calculated as described in (A).
Data information: Statistical significance (
P‐values) for the experiments was calculated using the paired two‐tailed
t‐test (*
P < 0.05; ns, non‐significant).

