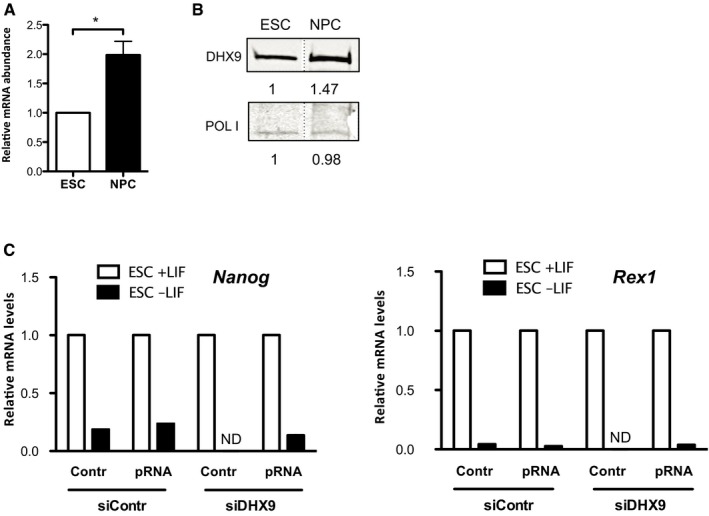
Figure EV5. Expression levels of DHX9 in ESCs and NPCs.

-
A, BDHX9 transcript (A) and protein (B) levels in ESCs and NPCs. RT–qPCR values (mean ± SD) from three independent experiments were normalized to Rps12 mRNA levels and to ESCs. Statistical significance (P‐values) for the experiments was calculated using the paired two‐tailed t‐test (*P < 0.05).
-
CqRT–PCR showing expression levels of pluripotency markers Nanog and Rex1 in ESCs + LIF and differentiated cells obtained upon withdrawal of LIF (ESCs−LIF). Values were normalized to rsp12 mRNA and the corresponding ESCs. Because of the few amounts of differentiated cells obtained upon DHX9 knockdown, mRNA levels in these samples could not be determined (ND). Data represent the mean of two independent experiments.
Source data are available online for this figure.
