-
A–D
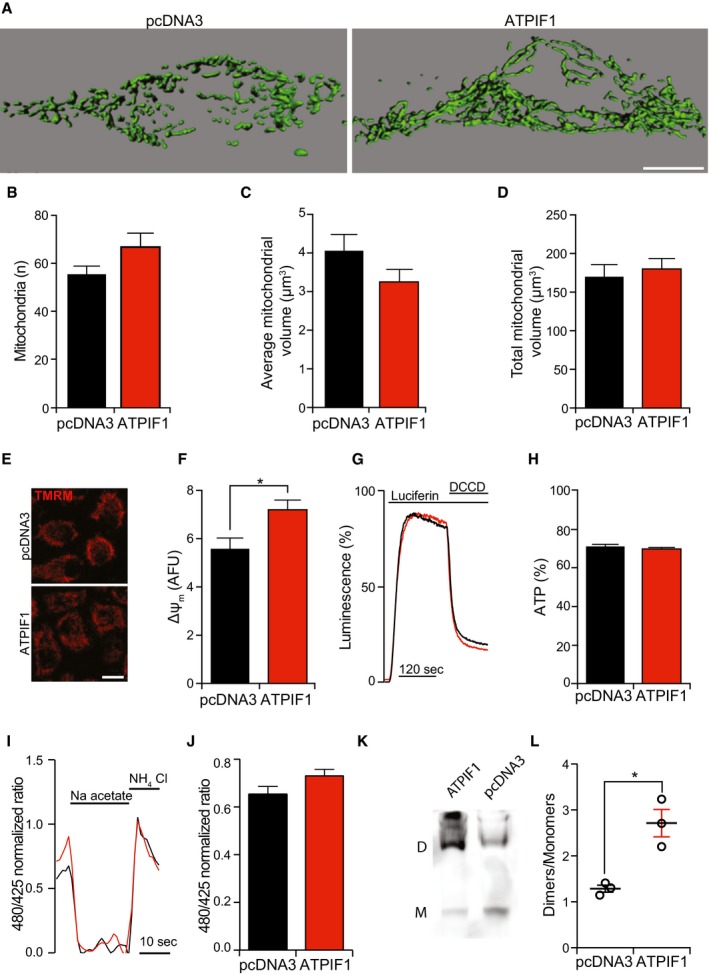
Representative rendering (A) and quantification of morphological parameters (count, B; average volume, C; total volume, D) in HEK293T cells transiently transfected with pcDNA3 or with a plasmid for the overexpression of ATPIF1. The results are representative of three independent experiments. Scale bar = 10 μm.
-
E, F
Representative images (E) and quantification (F) of TMRM staining in HEK293T cells transiently transfected with pcDNA3 or with a plasmid for the overexpression of ATPIF1. The results are representative of five independent experiments. *P = 0.0001 (unpaired Student's t‐test). Scale bar = 10 μm.
-
G, H
Representative traces (G) and quantification (H) of mitochondrial ATP‐dependent light emission in HEK293T cells transiently transfected with pcDNA3 or with a plasmid for the overexpression of ATPIF1. 75 μM N,N‐dicyclohexylcarbodiimide (DCCD) was employed to completely inhibit mitochondrial ATP synthesis. The results are representative of five independent experiments.
-
I, J
Representative traces (I) and quantification (J) of mtAlphi/ECFP ratio in HEK293T cells transiently co‐transfected with pcDNA3 or with a plasmid for the overexpression of ATPIF1. 30 mM Na acetate or 30 mM NH4Cl was employed to detect the minimum and maximum ratio, respectively. The results are representative of four independent experiments.
-
K, L
Representative immunoblotting for the detection of the ATP5A1 subunit after blue‐native PAGE (K) and quantification (L) of F1FO ATP synthase dimers (D) and monomers (M) in HEK293T cells transiently transfected with pcDNA3 or with a plasmid for the overexpression of ATPIF1. The results are representative of three independent experiments. *P = 0.0095 (unpaired Student's t‐test).
Data information: All results are expressed as mean ± SEM.