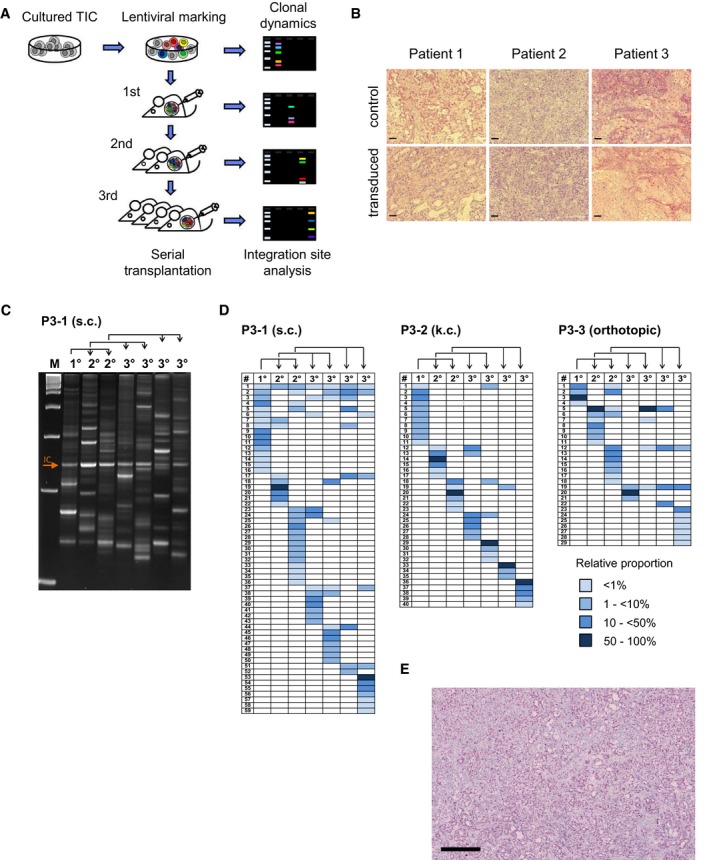
Figure 2. Long‐term tumor growth is maintained by transient activity of pancreatic TICs.

- Experimental strategy: Tumor‐initiating cells (TICs) from three individual primary pancreatic patient tumors were amplified in xenografts, enriched in adherent cultures, genetically marked by lentiviral transduction, and injected subcutaneously, under the kidney capsule, or orthotopically into NSG mice. Primary tumors (1°) were serially transplanted into secondary (2°) and tertiary (3°) recipient mice. Genomic lentiviral integration sites were monitored by LAM‐PCR and sequenced to decipher clonal dynamics of long‐term pancreatic tumor growth in vivo.
- Lentiviral marking does not affect the histology of xenograft tumors. Scale bars = 100 μm; control = tumors from untransduced cells.
- Multiple marked cell clones contributed to tumor formation in individual mice during serial transplantation. Each gel band represents an individual integration site amplified by highly sensitive LAM‐PCR. Representative data from patient P3 are shown.
- High‐throughput integration site sequencing demonstrated distinct sets of marked clones forming serial tumors within individual experiments. Pairs of mice transplanted with cells from the same donor showed sparse clonal overlap as demonstrated by very low representation of shared integration sites. Clonal analysis was performed for three patients; representative data from patient P3 are shown. Blue fields visualize relative contribution of individual clones as indicated in color legend; rows indicate individual lentiviral integration sites, and columns indicate individual xenografted tumors. Arrows indicate serial transplantation steps; IC: internal control; P3‐1/2/3: patient number 3‐experiment number 1/2/3. s.c.: subcutaneous transplantation; k.c.: kidney capsule transplantation.
- Ki67 staining of xenografts derived from TIC cultures demonstrated homogeneous distribution of active cycling and non‐cycling cells. Experiments done for P1–P3; representative data from P1 are shown. Scale bar: 500 μm.
