-
A
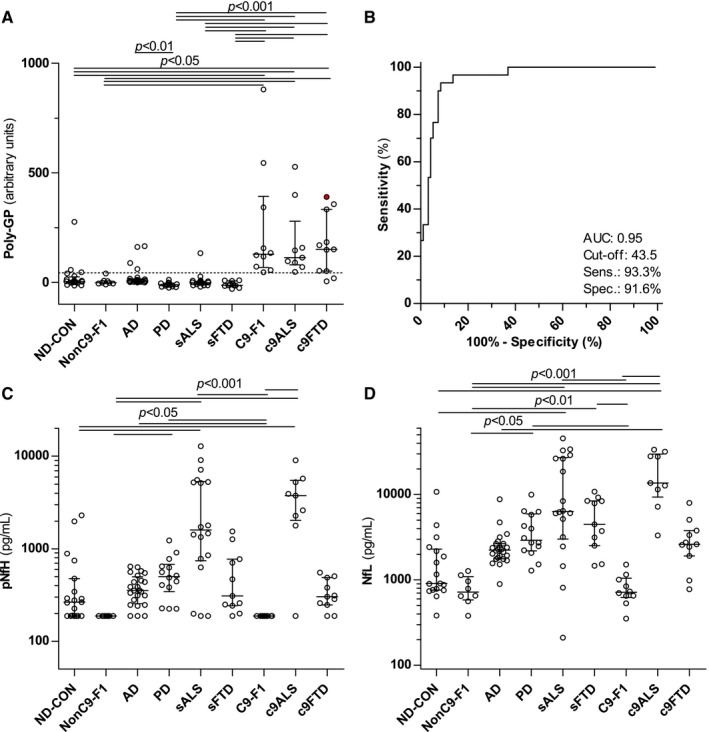
Poly‐GP was measured using immunoassay in an age‐matched control population without signs of a neurodegenerative disease (ND‐CON, n = 18–20), C9orf72‐negative offspring of C9orf72 mutation carriers (NonC9‐F1, n = 8) in patients with other neurodegenerative diseases, that is, Alzheimer's (AD, n = 24) and Parkinson's disease (PD, n = 14), sporadic ALS (sALS, n = 18) and FTD (sFTD, n = 11) patients, and asymptomatic (C9‐F1, n = 10) and symptomatic C9orf72 mutation carriers with ALS (c9ALS, n = 9) and FTD (c9FTD, n = 11). The c9FTD patient indicated by the filled, red circle was initially seen under the differential diagnosis of AD, but after poly‐GP measurement followed by C9orf72 genotyping reclassified as c9FTD.
-
B
Receiver operating characteristic (ROC) curve analysis of poly‐GP levels for the discrimination of C9orf72 mutation carriers vs. non‐carriers. The cutoff (43.5) was calculated using the Youden index and is shown as a dotted line in (A). AUC, area under the curve; Sens, sensitivity; Spec, specificity.
-
C, D
(C) Phosphorylated neurofilament heavy chain (pNfH) and (D) neurofilament light chain (NfL) were measured using an established ELISA.
Data information: Groups were compared by Kruskal–Wallis test and Dunn's
post hoc test. Bars and whiskers are median and interquartile range, and circles are individual values. Exact
P‐values poly‐GP (A): ND‐CON vs. c9FTD:
P = 0.0477; PD vs. AD:
P = 0.0053; ND‐CON vs. c9ALS:
P = 0.0483; ND‐CON vs. C9‐F1:
P = 0.0236; NonC9‐F1 vs. c9FTD:
P = 0.0365; NonC9‐F1 vs. c9ALS:
P = 0.0334; NonC9‐F1 vs. C9‐F1:
P = 0.0194; sALS vs. c9FTD:
P = 0.0006; sALS vs. c9ALS:
P = 0.0007; sALS vs. C9‐F1:
P = 0.0003; sFTD vs. c9FTD, sFTD vs. c9ALS, sFTD vs. C9‐F1, PD vs. c9FTD, PD vs. c9ALS, and PD vs. C9‐F1:
P < 0.0001. Exact
P‐values pNfH (C): PD vs. C9‐F1:
P = 0.0121; PD vs. NonC9‐F1:
P = 0.0261; sALS vs. ND‐CON:
P = 0.0103; C9‐F1 vs. AD:
P = 0.0334; ND‐CON vs. c9ALS:
P = 0.0142; NonC9‐F1 vs. c9ALS, C9‐F1 vs. c9ALS, sALS vs. C9‐F1, and sALS vs. NonC9‐F1:
P < 0.0001. Exact
P‐values NfL (D): sFTD vs. C9‐F1:
P = 0.0013; sFTD vs. NonC9‐F1:
P = 0.0038; PD vs. C9‐F1:
P = 0.0122; PD vs. NonC9‐F1:
P = 0.0245; c9ALS vs. AD:
P = 0.0107; sALS vs. ND‐CON:
P = 0.0017; sALS vs. NonC9‐F1:
P = 0.0001; sALS vs. C9‐F1, ND‐CON vs. c9ALS, NonC9‐F1 vs. c9ALS, and C9‐F1 vs. c9ALS:
P < 0.0001.