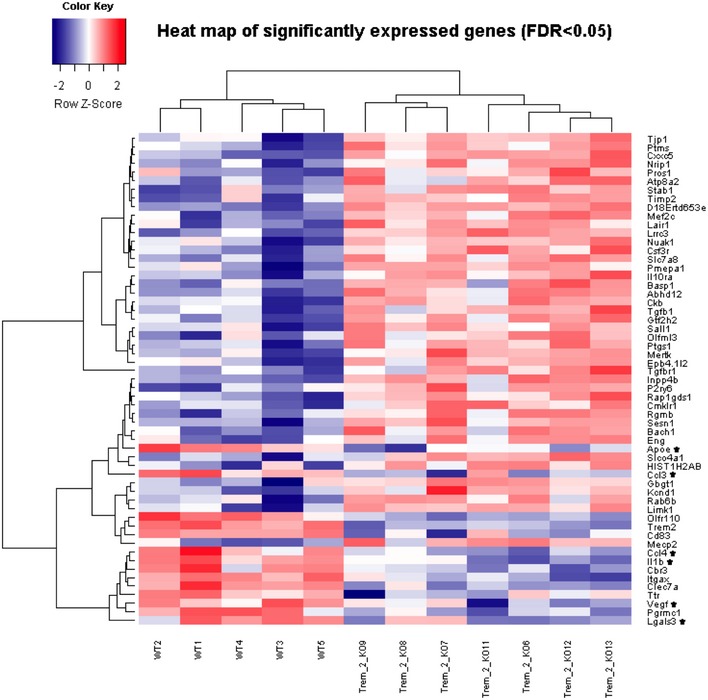
Figure EV1. Heat map of significantly expressed genes.

The heat map is based on normalized log2 expression levels of 57 significantly changed genes (FDR < 0.05) from the NanoString‐based chips. For generation of the heat map, the heatmap.2 function within the gplots package of R statistical software was used. Hierarchical clustering by the hclust function (method = “complete”) was applied to group experimental conditions (columns) as well as intensities of genes (rows). Rows were scaled and represented as z‐score. A dendrogram is shown for the samples (columns) as well as for gene expression levels (rows). Genes which show decreased expression levels in Trem2−/− mice (KO) compared to wild‐type mice (WT) and known to be involved in the functional categories chemotaxis and migration are highlighted by an asterisk.
