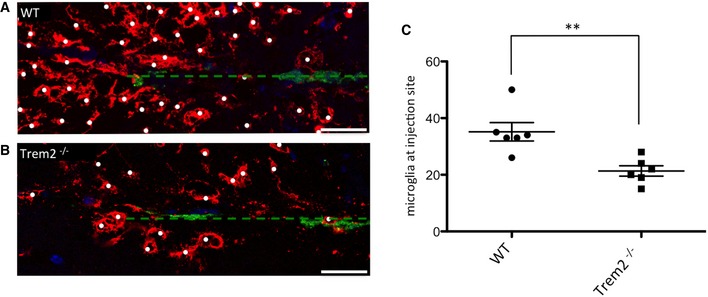
Figure 4. Reduced migration of Trem2‐deficient microglia towards apoptotic neurons in vivo .

-
A, BMigration of microglia towards injected Alexa 488‐labelled apoptotic neurons (green) in WT (A) and Trem2−/− (B) mouse brains. Microglial cells are visualized with the anti‐P2ry12 antibody (red) and nuclei with DAPI (blue). Dashed line indicates injection channel. Scale bar, 25 μm.
-
CQuantification of the number of microglia (labelled with white dots) clustered around the injection site. N = 6 individual mice per genotype. **P = 0.004 according to a two‐tailed Student's t‐test. The scatter plot shows data points from individual experiments. Horizontal lines represent mean values, error bars indicate standard deviations.
Source data are available online for this figure.
