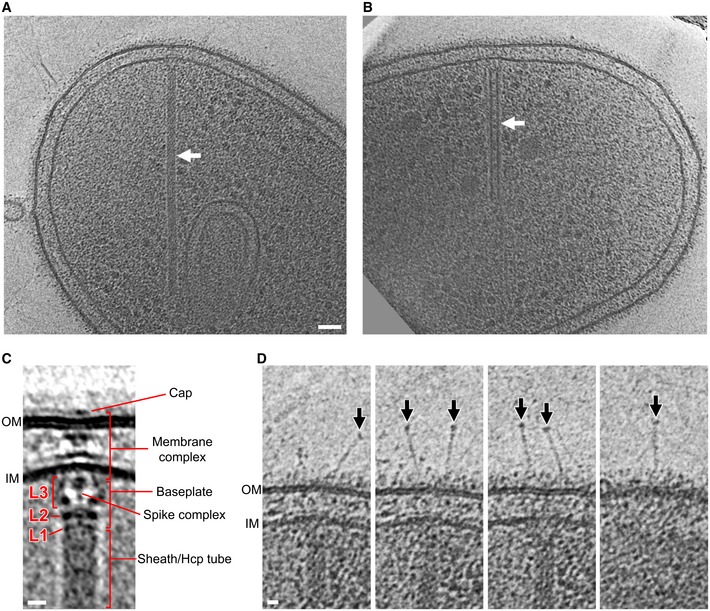
Figure 1. Visualization of the Myxococcus xanthus T6SS in vivo .

-
A, BTomographic slices through an extended T6SS (A) and a contracted T6SS (B) (arrows) in frozen‐hydrated M. xanthus cells.
-
CCentral slice of the sub‐tomogram average of the extended T6SS. L1–L3: different layers of densities in between the sheath and the IM.
-
DExtracellular bacteriophage tail fiber‐like antennae (arrows) captured in different slices of the tomogram shown in (A).
