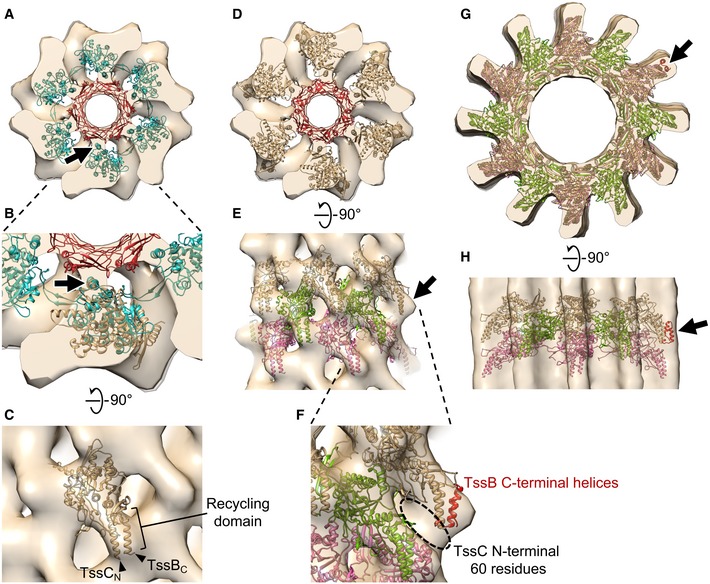
An atomic model of the extended R‐type pyocin (PDB 3J9Q) placed in the envelope of the extended T6SS sheath sub‐tomogram average, fitting the Hcp inner tube (red) and the attachment α‐helix (arrow) in the sheath (cyan) to corresponding densities. The envelope shown here contains two layers of the extended sheath.
Enlarged view of part of (A), with an MxTssBC model superposed on one sheath subunit of the R‐type pyocin structure. Arrow: the conserved attachment α‐helix in T6SS and R‐type pyocin sheath subunits.
Side view of (B) after the MxTssBC model was rotated to best fit the density. TssCN and TssBC indicate the N‐terminus of TssC and C‐terminus of TssB, respectively.
The model of hexameric MxTssBC‐MxHcp (one layer of the extended T6SS sheath) placed in the envelope of the extended M. xanthus T6SS sheath sub‐tomogram average. The envelope shown here contains two layers of the extended sheath.
Side view of (D) after fitting three consecutive layers of the hexameric MxTssBC‐MxHcp model (shown in different colors) into the envelope. Arrow: density not fully occupied by the model.
Enlarged view of part of (E), with the model of TssB C‐terminal helices (red; generated using PDB 4PS2) concatenated to the model in (E). Dashed circle: densities likely occupied by the TssC N‐terminal 60 amino acid residues, whose structure was absent in the MxTssBC model.
The homology model of the contracted M. xanthus T6SS sheath (generated using PDB 3J9G) placed into the envelope of the contracted T6SS sheath sub‐tomogram average. Three consecutive layers of the hexameric MxTssBC model are shown in different colors.
Side view of (G).
Data information: Arrows in (G) and (H) indicate additional densities, which can be partially filled by concatenating the model of TssB C‐terminal helices (red) as in (F). Note that both red helices are visible in (G) and (H), but due to view angle, they appear as one in (F).

