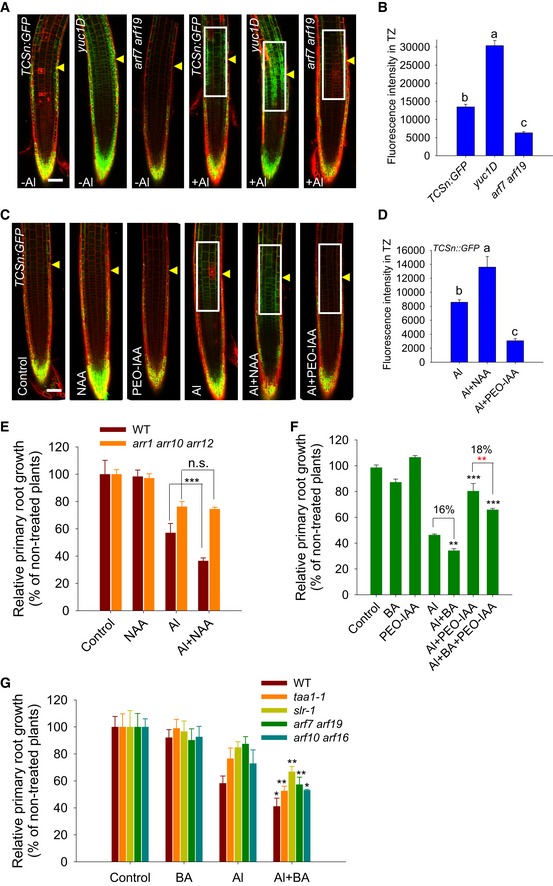
Six‐day‐old TCSn:GFP, TCSn:GFP/yuc1D, TCSn:GFP/arf7 arf19 seedlings were exposed or not (control) to 25 μM AlCl3 for 2 h. Cell boundaries appear red following propidium iodide staining. The TZ is marked by yellow arrowheads. Scale bar: 100 μm. The detected fluorescence region in (B) is marked by white rectangles.
Quantification of the Al‐induced fluorescence intensity in the TZ of TCSn:GFP, TCSn:GFP/yuc1D, TCSn:GFP/arf7 arf19 seedlings. The data are shown as mean ± SD (n = 15) with one‐way ANOVA and Tukey's test. Different letters indicate significant differences (P < 0.01).
The expression of the TCSn:GFP transgene in the epidermis of root‐apex TZ in the presence of Al with NAA or PEO‐IAA co‐treatments. Four‐day‐old transgenic TCSn:GFP seedlings were pre‐treated without or with 100 nM NAA for 2 days; then, the seedlings were continuously treated for 2 h with 0 or 25 μM AlCl3 in the presence of either 100 nM NAA or 15 μM PEO‐IAA. Cell boundaries appear red following propidium iodide staining. The root‐apex TZ is marked by yellow arrowheads. Scale bar: 100 μm. The detected fluorescence region in (D) is marked by white rectangles.
Quantification of the Al‐induced fluorescence intensity in the TZ of TCSn:GFP seedlings in the presence of NAA or PEO‐IAA co‐treatments. The data are shown as mean ± SD (n = 15) with one‐way ANOVA and Tukey's test. Different letters indicate significant differences (P < 0.01).
Root growth of WT and the arr1 arr10 arr12 triple mutant in the presence of 6 μM AlCl3 with or without 2.5 nM NAA for 7 days.
Root growth of WT seedlings after exposure to 6 μM AlCl3 with or without 2 nM BA or 0.5 μM PEO‐IAA for 7 days.
Root growth of WT seedlings and various mutants in the presence of 6 μM AlCl3 for 7 days with or without 2 nM BA.
Data information: In (F) black **, ***: means differ significantly in the presence of AlCl
3, BA, or/and PEO‐IAA treatments at, respectively,
P < 0.01 and
P < 0.001; red **: means differ significantly within PEO‐IAA and BA plus PEO‐IAA in the presence of AlCl
3 treatment at
P < 0.01. In (E) and (G), the data are shown as mean ± SD (
n = 3). *, **, and ***: means differ significantly within NAA or BA co‐treatment in the presence of AlCl
3 at, respectively,
P < 0.05,
P < 0.01, and
P < 0.001 (
t‐test). In (E), n.s.: not significant. In (F), percentage represents the difference of indicated bars by black line. At least 60 seedlings were analyzed from three biological repeats (around 20 seedlings for each repeat).

