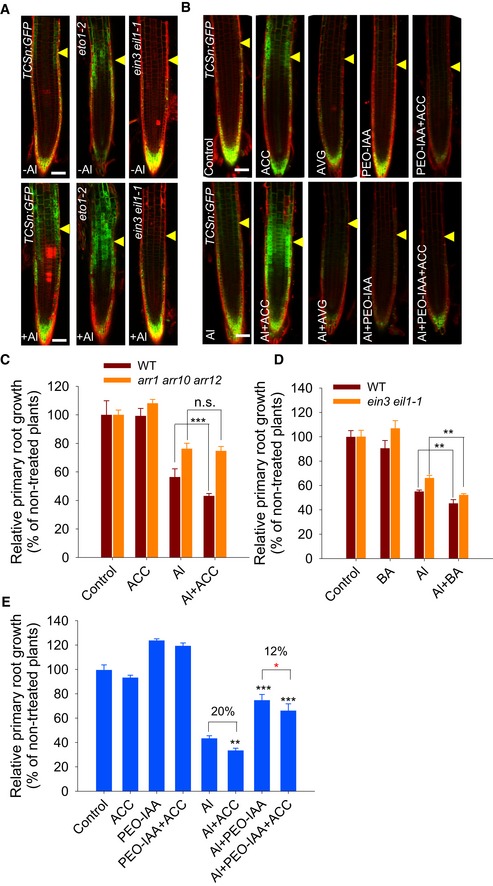
Six‐day‐old TCSn:GFP, TCSn:GFP/eot1‐2, TCSn:GFP/ein3 eil1‐1 seedlings were exposed or not (control) to 25 μM AlCl3 for 2 h. Cell boundaries appear red following propidium iodide staining. The TZ is marked by yellow arrowheads. Scale bar: 100 μm.
The expression of the TCSn:GFP transgene in the epidermis of root‐apex TZ in the presence of AlCl3 plus AVG, ACC, PEO‐IAA or ACC and PEO‐IAA co‐treatments. Four‐day‐old transgenic TCSn:GFP seedlings were pre‐treated without or with 1 μM AVG or 1 μM ACC for 2 days; then, the seedlings were continuously treated without or with 1 μM AVG, 1 μM ACC, 15 μM PEO‐IAA, or 1 μM ACC plus 15 μM PEO‐IAA in the absence or presence of 25 μM AlCl3 for 2 h. Control: non‐treated plants. Cell boundaries appear red following propidium iodide staining. The root‐apex TZ is marked by yellow arrowheads. Scale bar: 100 μm.
Root growth of the WT seedlings and the arr1 arr10 arr12 mutant was affected by a 7‐day exposure to 6 μM AlCl3 with or without 50 nM ACC. ***: means differ significantly with ACC co‐treatment in the presence of AlCl3, P < 0.001 (t‐test). n.s.: not significant.
Root growth of the WT seedlings and the ein3 eil1‐1 mutant was affected by a 7‐day exposure to 6 μM AlCl3 with or without 2 nM BA. **: means differ significantly with BA co‐treatment in the presence of AlCl3, P < 0.01 (t‐test). n.s.: not significant.
Root growth of WT seedlings following a 7‐day exposure to 6 μM AlCl3 in the absence or presence of 50 nM ACC or/and 0.5 μM PEO‐IAA. Black **, ***: means differ significantly in the presence of AlCl3, ACC, or/and PEO‐IAA at, respectively, P < 0.01 and P < 0.001 (t‐test); red *: means differ significantly within PEO‐IAA and ACC plus PEO‐IAA in the presence of AlCl3 treatment at P < 0.05.
= 3). In (E) percentage represents the difference of indicated bars by black string. At least 60 seedlings were analyzed from three biological repeats (around 20 seedlings for each repeat).

