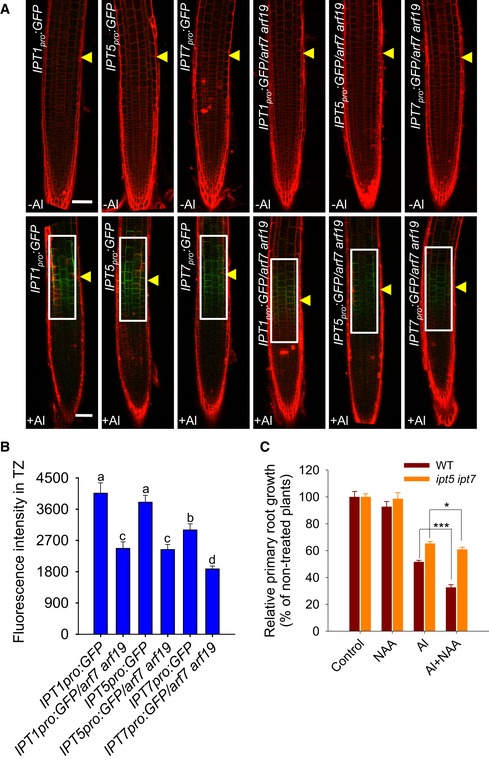
Six‐day‐old IPT1
pro
:GFP, IPT1
pro
:GFP /arf7 arf19, IPT5
pro
:GFP, IPT5
pro
:GFP /arf7 arf19, IPT7
pro
:GFP, and IPT7
pro
:GFP /arf7 arf19 seedlings were exposed or not (control) to 25 μM AlCl3 for 2 h. Cell boundaries appear red following propidium iodide staining. The TZ is marked by yellow arrowheads. Scale bar: 100 μm. The detected fluorescence region in (B) is marked by white rectangles.
Quantification of the Al‐induced fluorescence intensity in the TZ of IPT1
pro
:GFP, IPT1
pro
:GFP /arf7 arf19, IPT5
pro
:GFP, IPT5
pro
:GFP /arf7 arf19, IPT7
pro
:GFP, and IPT7
pro
:GFP /arf7 arf19 seedlings. Cell boundaries appear red following propidium iodide staining. The data are shown as mean ± SD (n = 15) with one‐way ANOVA and Tukey's test. Different letters indicate significant differences (P < 0.01).
Root growth of the WT and the ipt5 ipt7 mutant as affected by a 7‐day exposure to 6 μM AlCl3 with or without 2.5 nM NAA. The data are shown as mean ± SD (n = 3). * and ***: means differ significantly in the presence of AlCl3 and NAA treatment at, respectively, P < 0.05 and P < 0.001 (t‐test). At least 60 seedlings were analyzed from three biological repeats (around 20 seedlings for each repeat).

