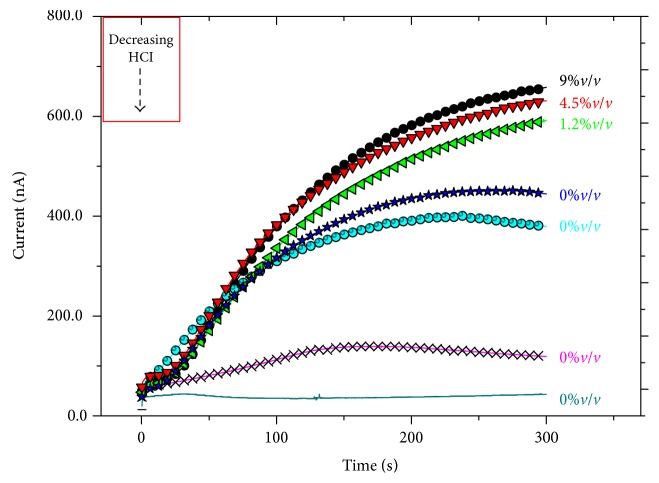
Figure 3.
Memristor's responses to the voltage stimulus reported in the inset of Figure 1 for a progressive lowering of chloride ion content in the polyelectrolyte: black circles represent the curve obtained with the polyelectrolyte solution at 9%v/v; red triangles 4.5%v/v; green triangles 1.2%v/v; blue stars 0%v/v; light blues 0%v/v (1° wash); pink line 0%v/v (2° wash); and dark green 0%v/v (3° wash).

