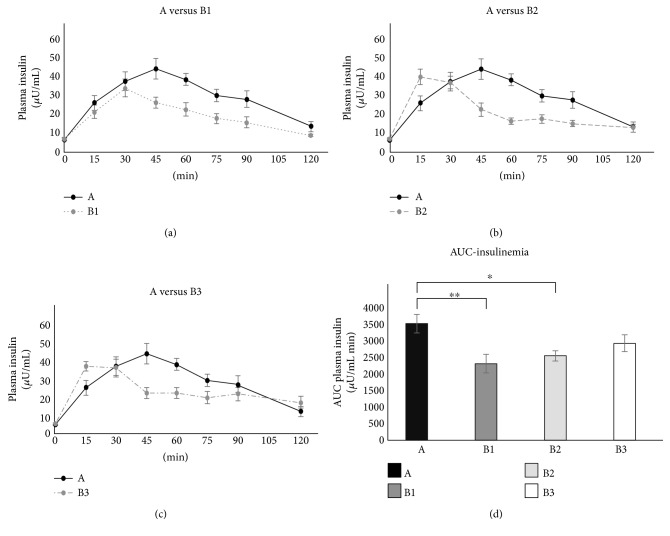
Figure 2.
The time courses of insulin concentrations following breakfasts (a) B1, (b) B2, and (c) B3, respectively. For the sake of comparison, each of the three panels also displays the time course of insulin concentration measured after glucose ingestion (black line, glucose). (d) The AUC of glycemia for each test. ∗p < 0.05; ∗∗p < 0.01.

