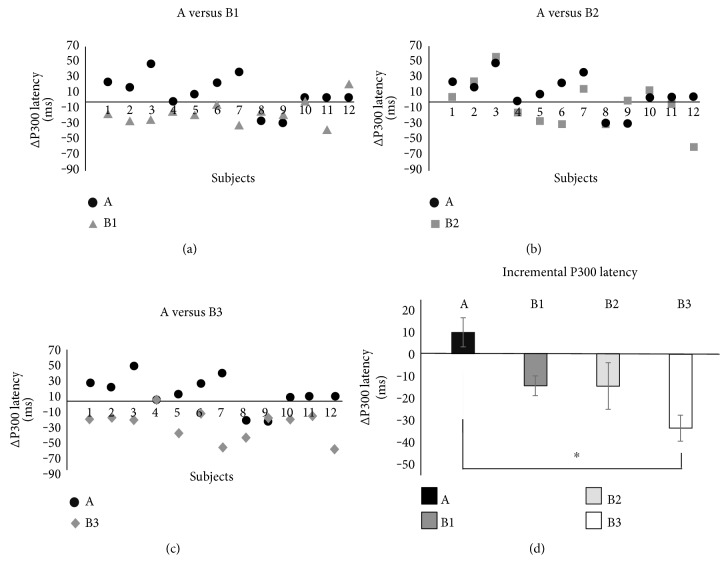
Figure 4.
The P300 latency incremental values measured in each of the twelve subjects in association to breakfasts (a) B1, (b) B2, and (c) B3, respectively. For the sake of comparison, each of the three panels also displays P300 latency incremental values measured in association to glucose ingestion (black dots, glucose). (d) The means of the P300 latency incremental values for each test. Of note is that a negative value stands for a peak anticipation. ∗p < 0.01.

