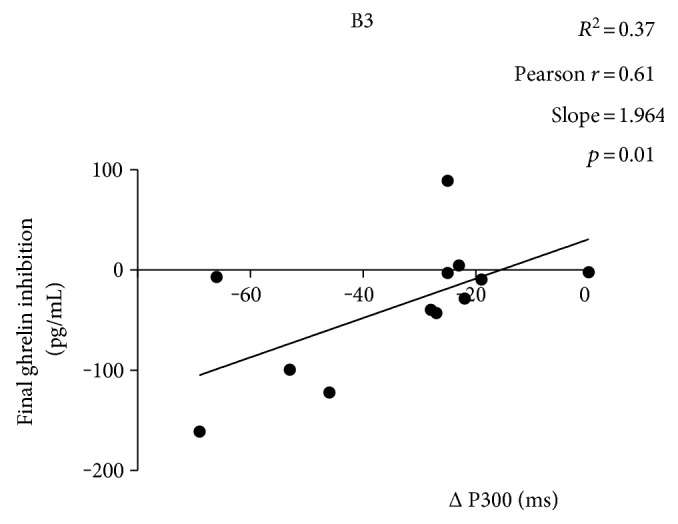
Figure 5.

Results of the linear regression analysis between plasma ghrelin inhibition and P300 latency incremental values. The two variables were positively correlated only after consumption of B3 (r = 0.61 with p = 0.01; slope coefficient = 1.96 pg/mL per ms).
