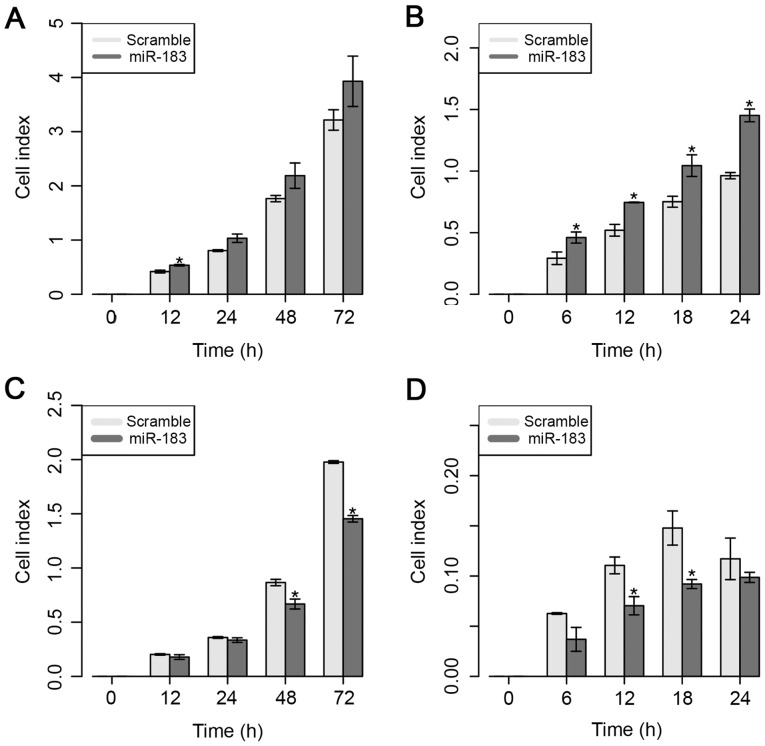
Figure 3.
Functional assays following miR-183 overexpression. (A) Proliferation was evaluated in the MDA-MB-231 cell line. (B) A migration assay was conducted in the MDA-MB-231 cell line. (C) A proliferation assay was performed in the MDA-MB-468 cell line. (D) Migration was assessed in the MDA-MB-468 cell line. Data are displayed as mean values ± standard error of ≥3 independent experiments. Differences were evaluated with the Student's t-test. *P<0.05. miR, microRNA.

