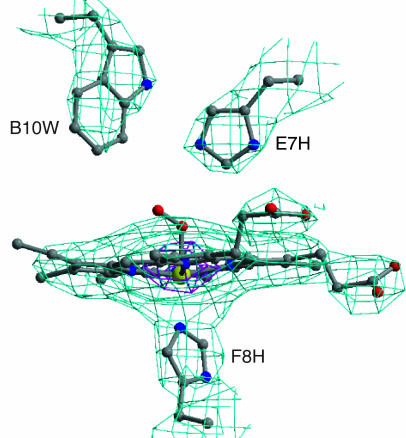
Fig. 1.
Six-fold-averaged electron density map for the R. pachyptila C1 Hb. The electron density map derived from phase extension by using molecular averaging of the six A1A2B1B2 tetramers in R. pachyptila C1 is shown for the heme region of the A2 subunit contoured at 3 σ (light blue) and 15 σ (purple). The quality of this 3.15-Å map is excellent and allows confident placement of side chains and clear definition of the heme iron position.

