Figure 3.
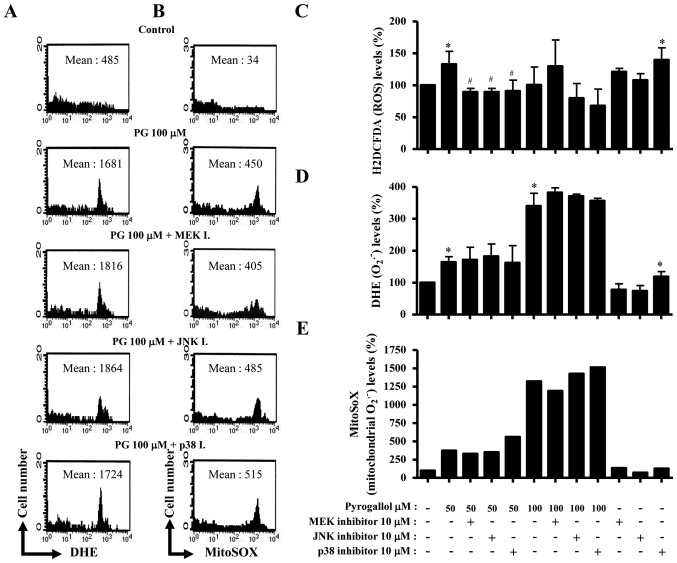
Effects of mitogen-activated protein kinase inhibitors on ROS levels in PG-treated HPF cells. ROS levels were measured using a FACStar flow cytometer. Representative graphs of (A) DHE (O2•−) and (B) mitoSOX (mitochondrial O2•−) levels in PG-treated HPF cells. (C) The graph indicates the percentage of ROS (as determined by H2DCFDA) levels compared with the control cells. The graphs indicate the percentage of (D) DHE (O2•−) levels from (A and E) mitoSOX (mitochondrial O2•−) levels from (B) compared with the control cells. *P<0.05 vs. control group. #P<0.05 vs. cells treated with 50 µM PG. ROS, reactive oxygen species; PG, pyrogallol; HPF, human pulmonary fibroblast; DHE, dihydroethidium; H2DCFDA, 2′,7′-dichlorodihydrofluorescein diacetate; MEK, mitogen-activated protein kinase kinase; JNK, c-Jun N-terminal kinase.

