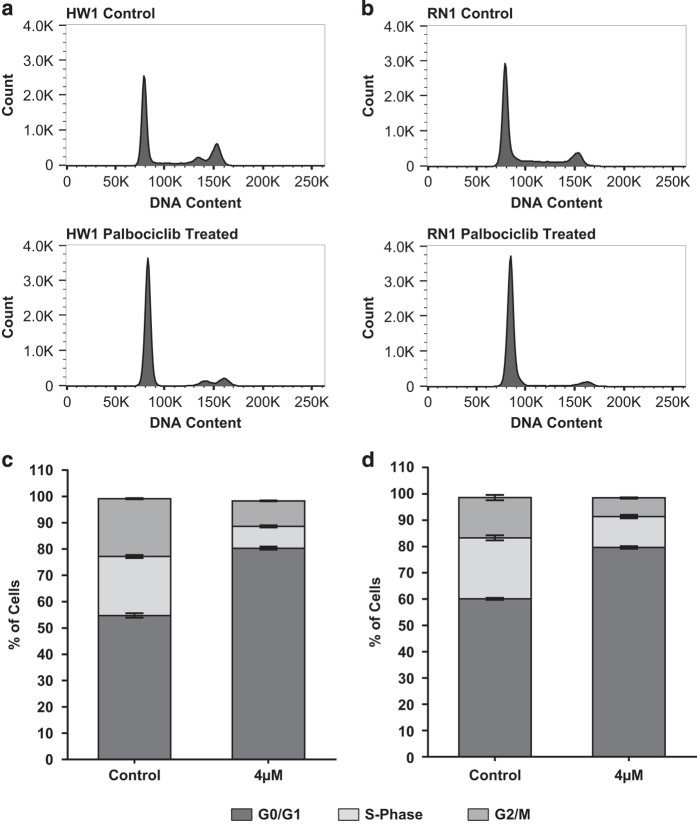
Figure 2.
Distribution of cell cycle phase in HW1 and RN1 cell lines treated with palbociclib. (a, b) DNA histograms generated by flow cytometry showing the distribution of cells in various stages of the cell cycle for cell lines HW1 and RN1. Cells were treated with either DMSO vehicle (control) or 4 μM palbociclib (treated) for 48 h. Histograms are representative of n=3 experiments. (c, d) Graphical representation of DNA histograms for HW1 and RN1 cell lines showing the percentage of cells in the G0/G1, S-Phase and G2/M phases of the cell cycle (n=3 experiments).

