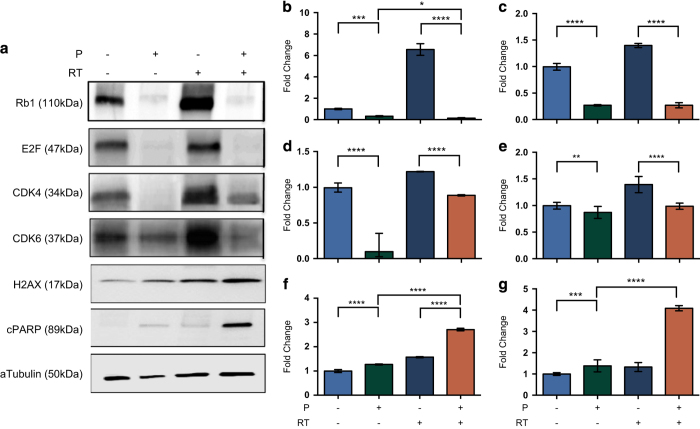
Figure 5.
Protein expression in response to treatment with palbociclib with or without RT. (a) Representative western blot and protein intensities determined using Image J software (NIH, Bethesda, MD, USA); (b) Rb1; (c) E2F; (d) CDK4; (e) CDK6; (f) H2AX; (g) cPARP. *P<0.05; **P<0.01; ***P<0.005; ****P<0.001.

