
Figure 5. miR-33 inhibition increases LC3 expression in atherosclerotic plaques.
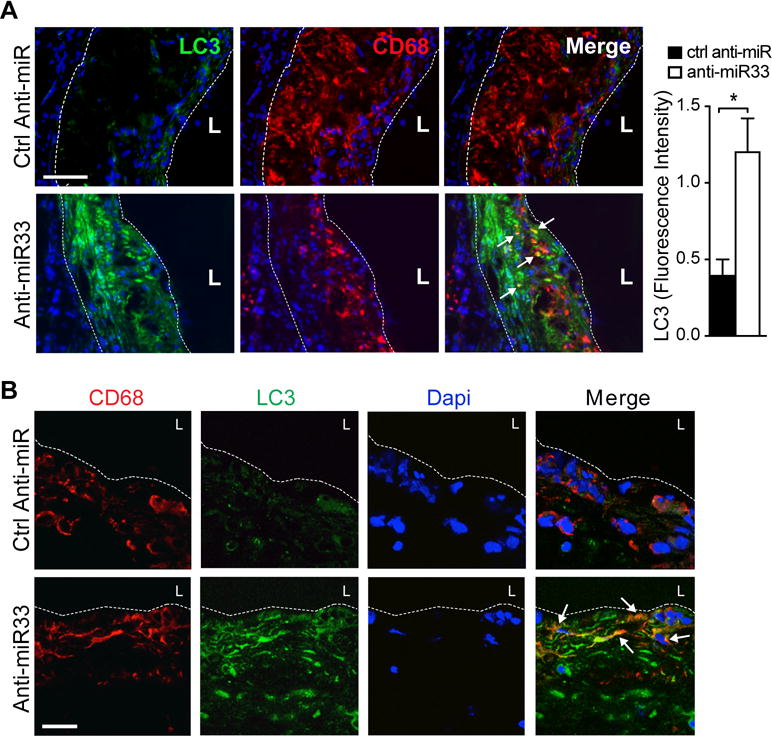
A) Representative immunofluorescence staining of CD68 (red) and LC3 (green) and their colocalization (yellow) in atherosclerotic plaques of Ldlr−/− mice described in (A). At right, quantification of LC3 fluorescence intensity in plaques is shown (n=7 mice / group). B) Confocal microscopy of LC3 (green) and CD68 (red), and their colocalization (merge), in aortic sinus atherosclerotic plaques of Ldlr−/− mice undergoing atherosclerosis regression. Dashed lines indicate plaque borders. L= lumen. Scale bar = 100μm.