
Figure 1.
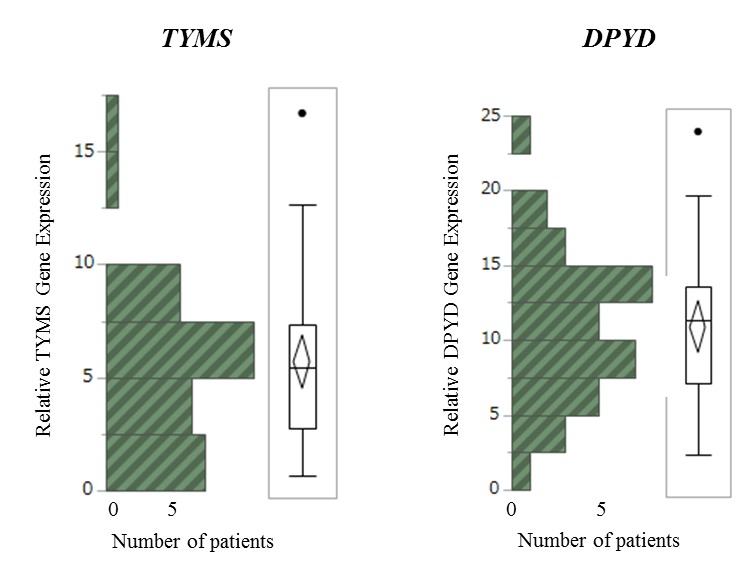
Bar chart and box-and-whisker plots of relative TYMS and DPYD mRNA expression levels in the S-1 group, as determined by reverse transcription-quantitative polymerase chain reaction. TYMS, thymidylate synthase; DPYD, dihydropyrimidine dehydrogenase.