
Figure 1.
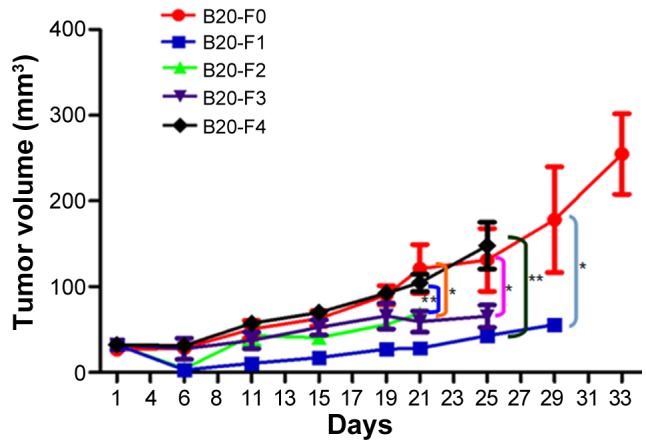
Tumor growth curves of non-small cell lung cancer xenografts. In the F1-F3 groups, the tumor sizes were similar, indicating the continuous inhibitory effects of anti-VEGF antibody on tumor growth. The tumor growth rate was significantly lower in the F3 group compared with in the F0 (control) group (P<0.01), suggesting that resistance to the B20 antibody was not successfully acquired. The tumor growth rate in the F4 group was similar to that in F0, indicating the withdrawal of inhibition by the anti-VEGF antibody. *P<0.01, F0 vs. F1/F2/F3; **P<0.05, F4 vs. F1/F2; n=3-6. VEGF, vascular endothelial growth factor; F0, mice injected with A549 cells only; F1, mice injected with A549 cells and treated with B20 twice weekly; F2, mice transplanted with F1 tumor explant and treated with B20 twice weekly; F3, mice transplanted with F2 tumor explant and treated with B20 twice weekly; F4, mice transplanted with F3 tumor explant with no treatment.