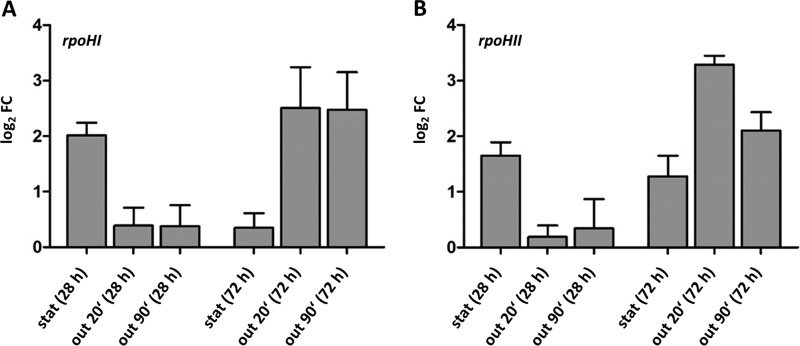
FIG 4.
Log2 fold changes in rpoHI and rpoHII mRNA levels in stationary phase (stat) or outgrowth (out; 20 and 90 min) compared to the levels in exponential phase as determined by real-time RT-PCR. Values were normalized to the input RNA amount. The data represent the means of the results from at least three independent experiments, and error bars indicate standard deviation.

