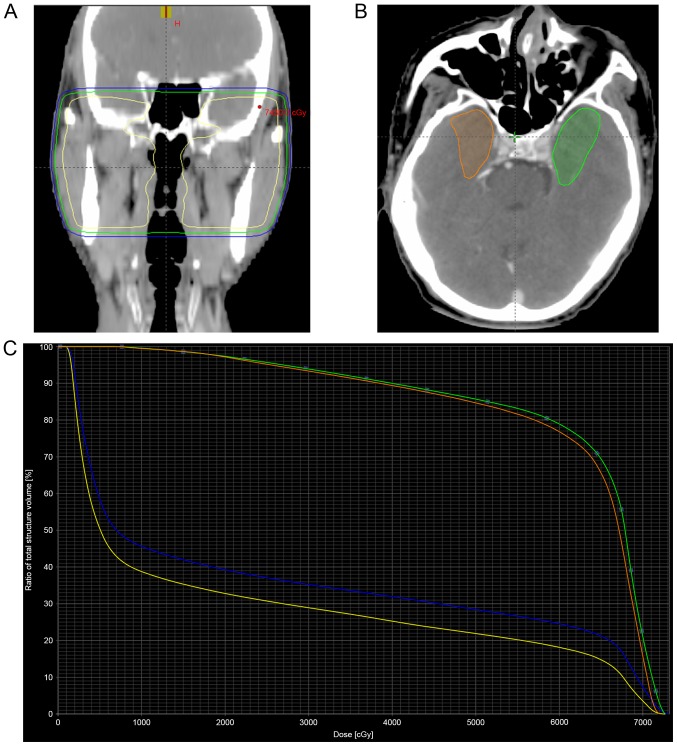
Figure 1.
Dose distribution and dose-volume histogram of a patient treated with two-dimensional radiotherapy to 70 Gy. (A) The yellow, green and blue curves represent the isodose curves of 70, 60 and 50 Gy, respectively. (B) A transverse planning computed tomography image shows the delineation of the inferior and medial aspects of the bilateral temporal lobes (green, left; orange, right). (C) Dose-volume histogram for the temporal lobes. The blue curve corresponds to the left temporal lobe, while the yellow curve corresponds to the right temporal lobe. The green and orange curves correspond to the inferior and medial aspects of the left and right temporal lobes, respectively.

