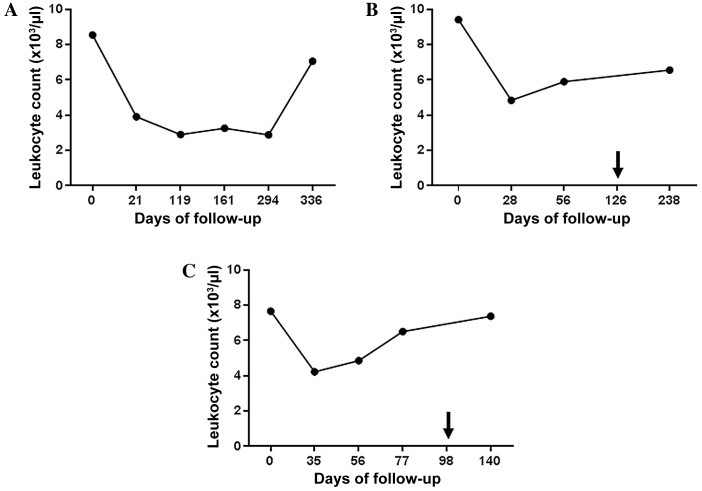
Figure 1.
Immunomonitoring of leukocyte count. Graphs show the leukocyte counts of (A) patient A, (B) patient B and (C) patient C, prior to, during and subsequent to therapy with the tyrosine kinase inhibitor sunitinib. Arrows indicate the time points when the treatment regimen was changed (fromsunitinib to everolimus in patient B, and from sunitinib to sorafenib in patient C).

