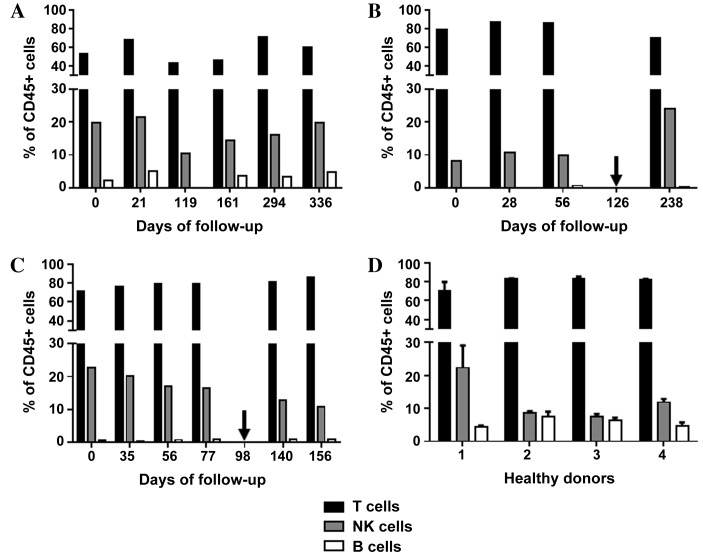
Figure 2.
Immunomonitoring of T, NK, and B cells. Graphs show the levels of T cells, NK cells and B cells as a percentage of all CD45+ cells in (A) patient A, (B) patient B and (C) patient C, prior to, during and subsequent to therapy with the tyrosine kinase inhibitor sunitinib. Arrows indicate the time points when the treatment regimen was changed (from sunitinib to everolimus in patient B, and from sunitinib to sorafenib in patient C). (D) The means+ standard deviations of three measurements are included for each of the healthy donor controls (nos. 1–4). NK cells, natural killer cells; CD45, cluster of differentiation 45.

