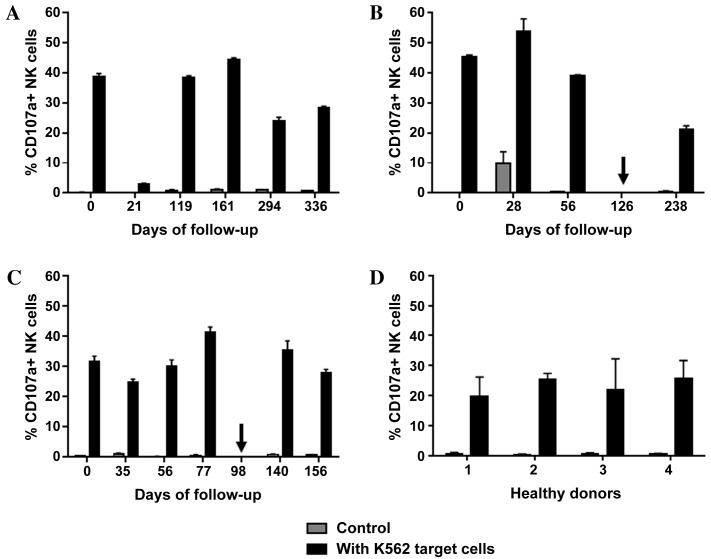
Figure 4.
NK cell degranulation. For each patient and time point, triplicate experiments with and without (control) K562 target cells were performed. The data presented includes mean + standard deviation. The proportion of CD107a+ NK cells in (A) patient A, (B) patient B and (C) patient C prior to, during and subsequent to therapy with the tyrosine kinase inhibitor sunitinib are presented. Arrows indicate the time points when the treatment regimen was changed (from sunitinib to everolimus in patient B, and from sunitinib to sorafenib in patient C). (D) Measurements of CD107a+ proportion from day 0, 60 and 91 are included for each of the healthy donor controls (nos. 1–4). NK cells, natural killer cells; CD16, cluster of differentiation 16.

