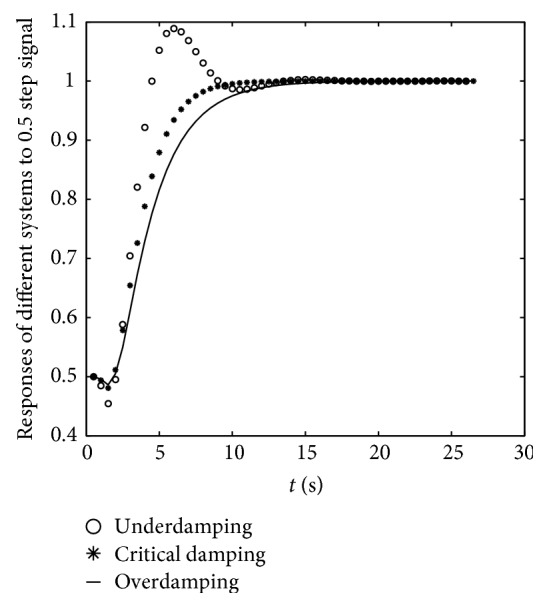
Figure 7.

The system response to step signal with amplitude of 0.5 in the environment mass-spring-damp system with different damping coefficients. x: the time of response; y: response values to 0.5 step signal. The continuous black solid line was the response of overdamping system, and it had no overshoot and a stable value at the end.
