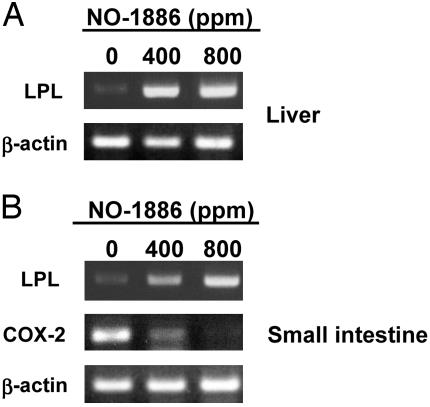
Fig. 6.
Changes of mRNA levels for LPL and COX-2 in the liver and small intestine of female Min mice. (A) RT-PCR analysis of LPL mRNA expression in the livers of female Min mice given diets containing NO-1886 at doses of 0, 400, and 800 ppm for 13 weeks. (B) RT-PCR analysis of LPL and COX-2 mRNA expression in normal parts of the small intestine of female Min mice given diets containing NO-1886 at doses of 0, 400, and 800 ppm for 13 weeks. Data are representative of three mice of each group.

