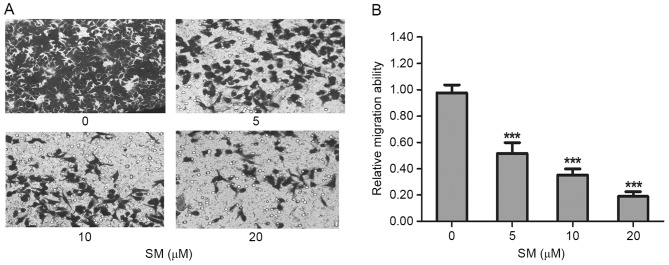
Figure 3.
Migration ability of cells as evaluated by Transwell assay. (A) Following cell migration from the upper into the lower wells, the cells were stained, imaged and counted. Subsequent to treatment with 0, 5, 10 and 20 µM SM, the migration number of HepG2 cells decreased as the concentration of SM increased. (B) Statistical results of relative migration ability. SM-treated cells revealed significant differences compared with the untreated cells. ***P<0.001 vs. 0 µM SM treatment group. Magnification, ×200. SM, solamargine.

