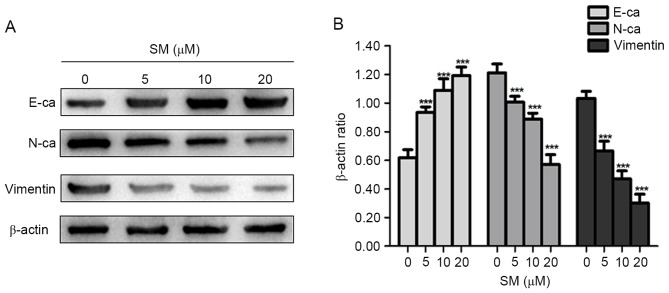
Figure 5.
HepG2 cells were treated with various concentrations (0, 5, 10, 20 µM) of SM for 24 h. (A) The expression levels of EMT representative proteins (E-ca, N-ca and Vimentin) in HepG2 cells were determined by western blotting analysis. β-actin was used as the loading control. (B) Statistical results of western blotting analysis. Results are representative of ≥3 independent experiments. ***P<0.001 vs. 0 µM SM group. SM, solamargine; E-ca, E-cadherin; N-ca, N-cadherin.

