
Fig. 4.
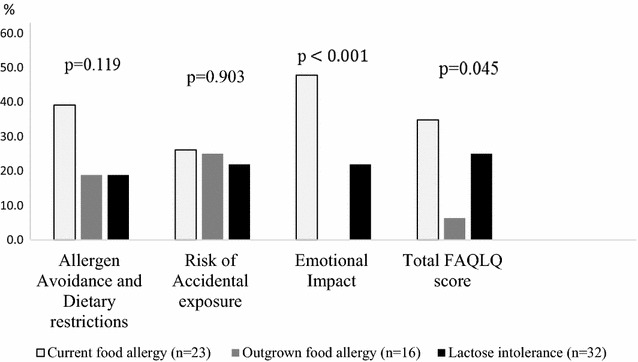
Prevalence (%) of poor HRQL (≥75 percentile) in FAQLQ-TF domains by food hypersensitivity phenotypes. A higher score indicate a poorer HRQL. Difference between groups was analysed by Linear by linear association (Mantel–Haenszel)
Official websites use .gov
A
.gov website belongs to an official
government organization in the United States.
Secure .gov websites use HTTPS
A lock (
) or https:// means you've safely
connected to the .gov website. Share sensitive
information only on official, secure websites.
Prevalence (%) of poor HRQL (≥75 percentile) in FAQLQ-TF domains by food hypersensitivity phenotypes. A higher score indicate a poorer HRQL. Difference between groups was analysed by Linear by linear association (Mantel–Haenszel)