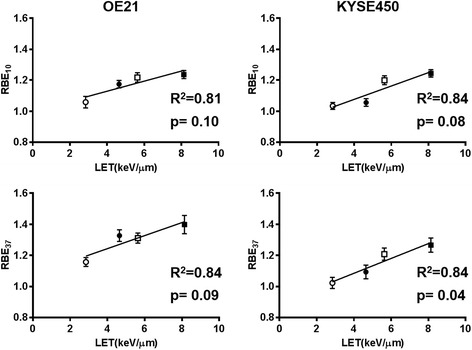
Fig. 3.

Correlation between the RBE and the LET. The clear and filled circles show the results for positions #1 and #2 on the SOBP, respectively. The clear and filled squares show the results for positions #3 and #4 on the SOBP, respectively. Error bars indicate the standard error of the mean. A strong positive correlation between the RBE and LET was observed in both the OE21 and KYSE450 cells
