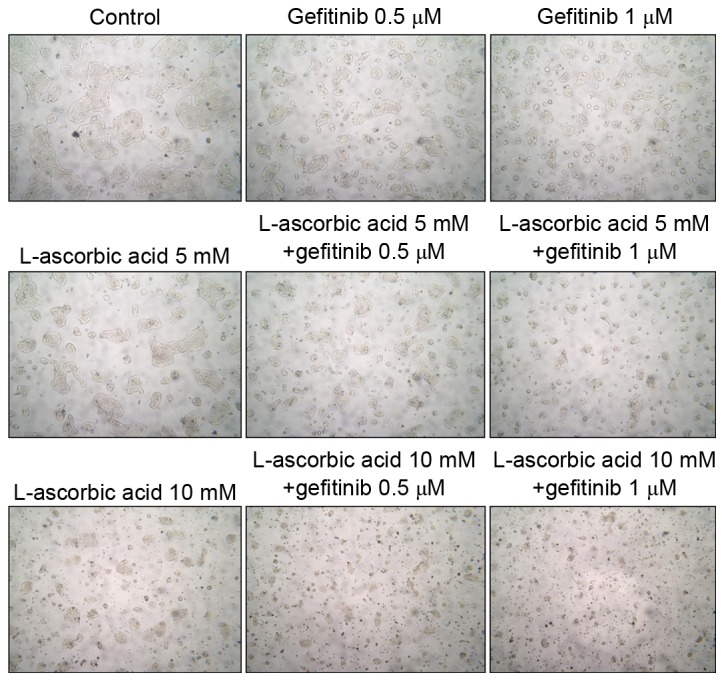
Figure 2.

Microscopic images of Calu-3 cells treated with gefitinib and/or L-ascorbic acid. (Microscopic images were captured at magnification, ×100, to illustrate the relative cellular growth patterns. A total of 1×10⁶ cells were cultured in T25 culture flasks with/without L-ascorbic acid and gefitinib at various concentrations: 0.5 or 1 µM of gefitinib and 5 or 10 mM L-ascorbic acid. Cells were pre-treated with L-ascorbic acid for 1 h and then treated with gefitinib for 48 h. The figure is representative of three independent experiments.
