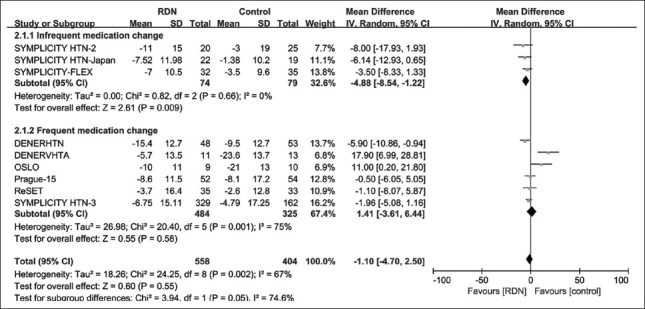
Figure 5.

Forest plot for mean difference in 24-h SBP at 6-month follow-up by medication change rate subgroup. Frequent medication change: the medication change rate >25%; Infrequent medication change: The medication change rate <25%; SBP: Systolic blood pressure; CI: Confidence interval; RDN: Renal denervation.
