Fig. 3.
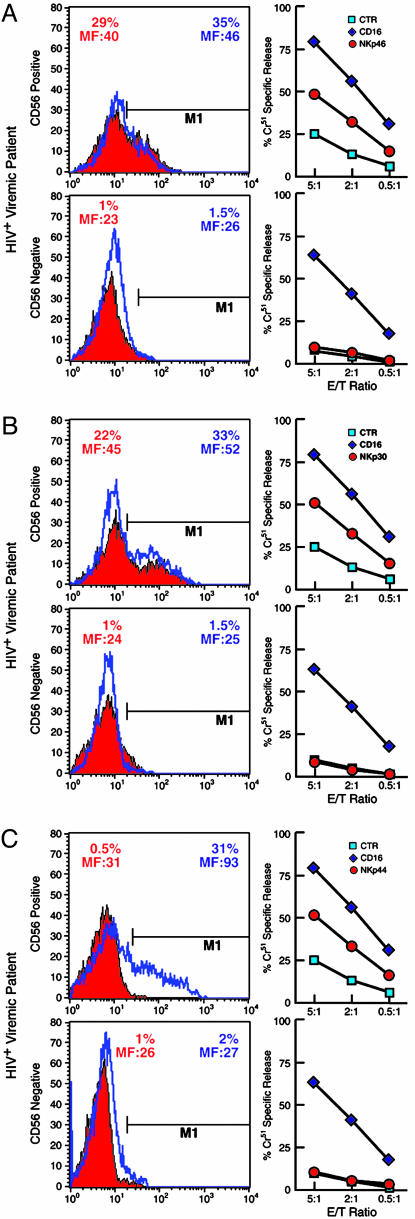
Expression and function of NCRs on CD56+ and CD56– NK cell subsets. CD56+ (Upper) and CD56– (Lower) NK cell subsets were analyzed for NCR expression (Left) and function (Right). Histograms indicate the percent of freshly isolated (solid red) or rIL-2-activated (blue lines) CD56+ and CD56– NK cells expressing NKp46 (A), NKp30 (B), and NKp44 (C). The percentage of NK cells expressing NCRs with their geometric mean fluorescence intensity (MF) are indicated. Functional evaluation of NCRs by a redirected killing assay using an FcγR+ P815 target cell line and IL-2-activated NK cell subsets are adjacent to each histogram. Every graph shows the baseline lysis (blue squares), the maximal lysis triggered by anti-CD16 IgG mAb (blue diamonds), and killing driven by the relevant activating NK receptors (red circles). Data are from a single experiment and are representative of data obtained by using cells isolated from 48 HIV-viremic patients whose expression and function of NCRs were similar.

