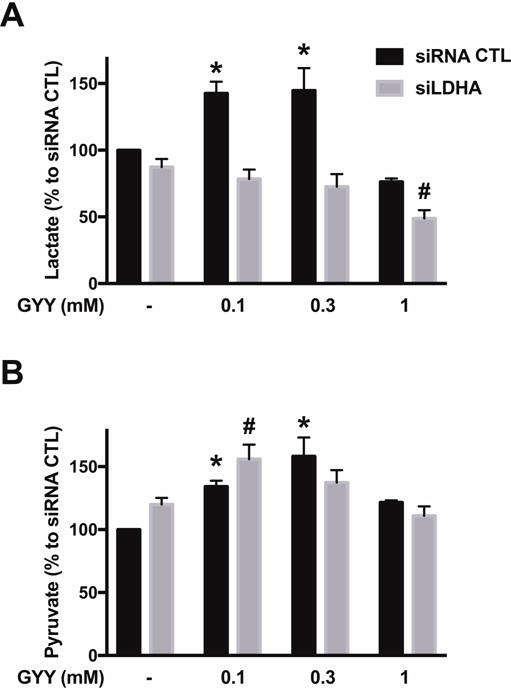
Figure 3. LDHA silencing suppresses H2S-stimulated lactate production in HCT116 cells.

HCT116 cells (either with scrambled siRNA treatment or with siRNA-mediated LDHA silencing) were treated with vehicle or GYY4137 (0.1, 0.3 or 1 mM) for 24 h. Total cellular lactate (A) or pyruvate (B) levels were determined via lactate or pyruvate assay kits, respectively. Absolute control values for lactate and pyruvate amounted to 17.45±0.67 and 2.05+0.47 μmoles/g cell extract. Data represent mean ± SEM and expressed as a percentage of the corresponding siRNA CTL group. n = 4–5, for each group (A); n = 3–5, for each group (B). *P < 0.05 vs. siRNA CTL, #P < 0.05 vs. siLDHA CTL (based on one-way ANOVA corrected with Tukey’s post-hoc test).
