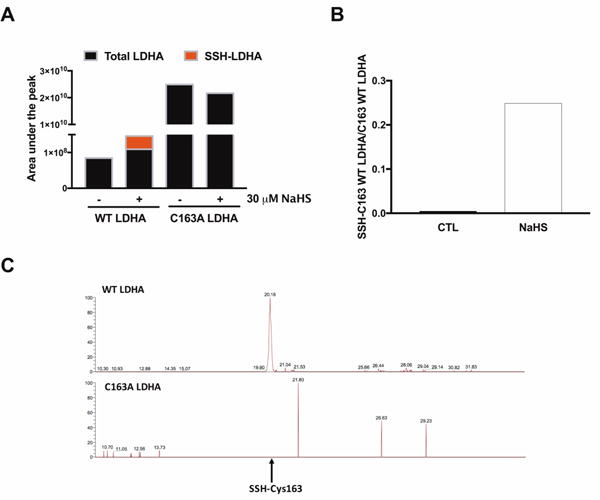
Figure 9. H2S S-sulfhydrates LDHA on Cys 163.

(A) S-sulfhydration of LDHA (1 μg; Sigma–Aldrich LDHA) under various concentrations of NaHS (10–300 μM) in the presence or absence of 1 mM DTT. n = 5–6, for each group. *P < 0.05 vs. untreated group (based on one-way ANOVA corrected with Tukey’s post-hoc test); #P < 0.05 shows the significant inhibitory effect of DTT (300 μM NaHS vs. 300 μM NaHS+ 1 mM DTT). (B) XIC of LDHA treated with 10 or 100 μM NaHS. (C) Figure represents the ratio of the area under the peak of SSH-Cys163 vs. the area under the peak of the digested peptide without S-sulfhydration modification in LDHA. Data represent mean ± SEM and expressed as a percentage of the corresponding CTL.
